Tolhuin Weather & Climate: Best Time to Visit
Average temperatures, rainfall, sunshine and the best time to visit Tolhuin.
Climate overview of Tolhuin
Tolhuin, Tierra del Fuego, Argentina, experiences moderate temperature changes through the seasons. January is the warmest month with daytime highs of 15°C (59°F), while July is the coolest at 4°C (39°F).
With around 637 mm (25 in) of annual rain/snowfall, the city has moderate precipitation levels. December is the wettest month and July the driest. It also has a distinct dry season from July to September.
Tolhuin Weather by Month
Pick a month to see the average temperature, rainfall and sunshine in Tolhuin — and find the best time to visit.
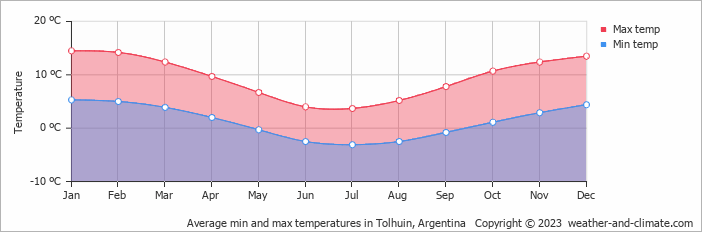
Monthly Temperature in Tolhuin
The weather in Tolhuin changes moderately throughout the year, offering enough variation to appreciate each season. Typically, average maximum daytime temperatures range from a moderate 15°C (59°F) in January to a chilly 4°C (39°F) in the coolest month, July.
Nights vary from 5°C (41°F) in January to around -3°C (27°F) during the colder months.
Check out our detailed temperature page for more information.
Temperature ranges by month
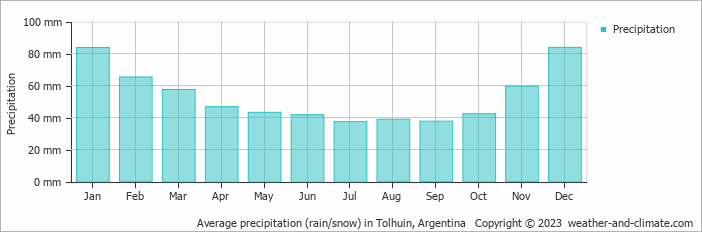
Rainfall in Tolhuin
Generally, Tolhuin has a moderate amount of precipitation, averaging 637 mm (25 in) of rain/snowfall annually. The climate in Tolhuin shows significant variation throughout the year. Expect moderate rainfall in December, the wettest month, with an average of 84 mm (3.3 in) of precipitation over 12 rainy days.
In contrast, the driest month July offers drier and sunnier days, with around 37 mm (1.5 in) of snow/rainfall over 8 snowy/rainy days. For more details, please visit our Tolhuin Precipitation page.
The mean monthly precipitation over the year, including rain, hail, and snow
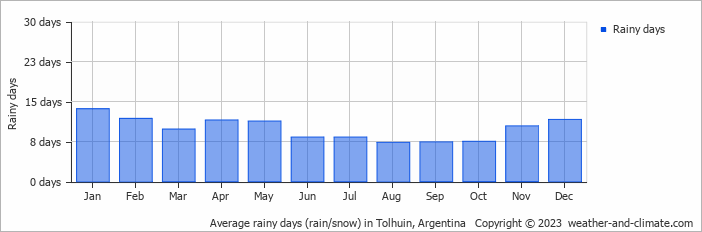
The average number of days each month with precipitation
Best Time to Visit Tolhuin
Check the specific monthly conditions to plan your visit according to your weather preferences and planned activities. Wondering where to travel based on your weather preferences? Our recommendation tool helps you find destinations with your ideal climate conditions. Use our weather planner to find your perfect destination.
Frequently asked questions about the climate in Tolhuin
What is the best time to visit Tolhuin?
January, February and December typically offer the most optimal weather in Tolhuin. In contrast, April, May, June, July, August and September tend to have less optimal conditions. Tolhuin has a distinct dry season from July to September.
What temperatures can I expect in Tolhuin?
Daytime highs range from 4°C (39°F) in July to 15°C (59°F) in January. Nighttime lows range from -3°C (27°F) to 5°C (41°F).
How much rain does Tolhuin get?
Annual rainfall is around 637 mm (25 in). December is the wettest month with 84 mm (3.3 in), while July is the driest with 37 mm (1.5 in).
Tolhuin 3-Day Forecast
Tolhuin 3-Day Forecast
Tolhuin on the map
Tolhuin is highlighted — select any city to see its climate.
Popular this month
Where to go in July — average daytime high across popular destinations.
Bucket list
Need travel inspiration? Check out our bucket list articles and be inspired.
 The 10 most alternative cities in South America
Discover South America's top 10 alternative cities! From Valparaíso's vibrant streets to La Paz's high-altitude charm and Medellín's innovative spirit.
Be amazed by Buenos Aires
The city of beautiful museums, cute streets, green parks, lots of good food, interesting local neighborhoods and impressive historical buildings.
Explore Patagonia
A tour through Patagonia brings you to the end of the world. That’s why Patagonia is a bucket list destination for many. We recommend to visit Patagonia from November to early March.
Glacier walk on The Perito Moreno glacier
The Perito Moreno glacier and the rupture of this glacier is considered one of the most impressive natural spectacles in the world. You can wait here until a large piece of ice crumbles and plunges into the water with a lot of noise.