Santillana del Mar Weather & Climate: Best Time to Visit
Average temperatures, rainfall, sunshine and the best time to visit Santillana del Mar.
Climate overview of Santillana del Mar
Santillana del Mar, Cantabria, Spain, sees big temperature differences between seasons, with August peaking at 24°C (75°F) and February dropping to 13°C (55°F).
The city has a wet climate, receiving around 1252 mm (49 in) of rainfall per year. November is the wettest month. The sunniest month is July, with 7.5 hours of sunshine per day on average.
Santillana del Mar Weather by Month
Pick a month to see the average temperature, rainfall and sunshine in Santillana del Mar — and find the best time to visit.
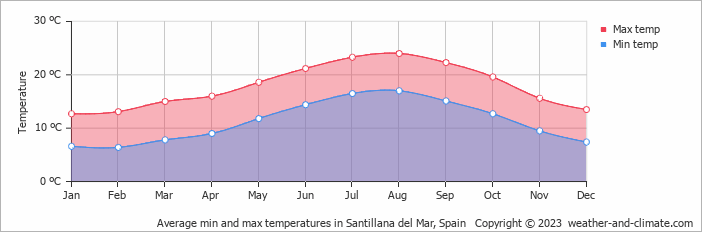
Monthly Temperature in Santillana del Mar
Visitors to Santillana del Mar can expect significant temperature changes throughout the year. On average, daytime temperatures range from a comfortable 24°C (75°F) in August to a moderate 13°C (55°F) in February.
Nighttime temperatures range from 17°C (63°F) in August to 6°C (43°F) in February.
Check out our detailed temperature page for more information.
Temperature ranges by month
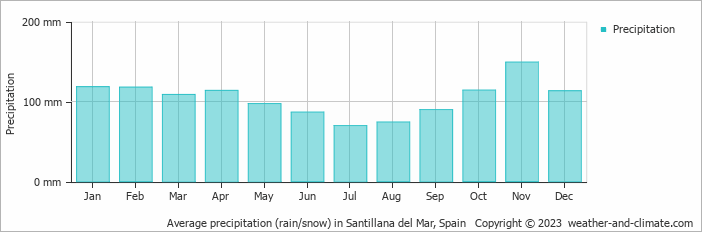
Rainfall in Santillana del Mar
Santillana del Mar is known for its substantial rainfall, with annual precipitation reaching 1252 mm (49 in). The amount of precipitation varies moderately throughout the year. The wettest month, November, sees around 149 mm (5.9 in) of rainfall, perfect for those who enjoy a bit of rain now and then. The driest month, July, still receives a respectable 70 mm (2.8 in) of rainfall. For more details, please visit our Santillana del Mar Precipitation page.
The mean monthly precipitation over the year, including rain, hail, and snow
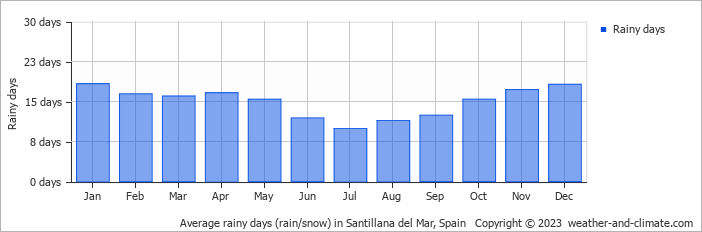
The average number of days each month with precipitation
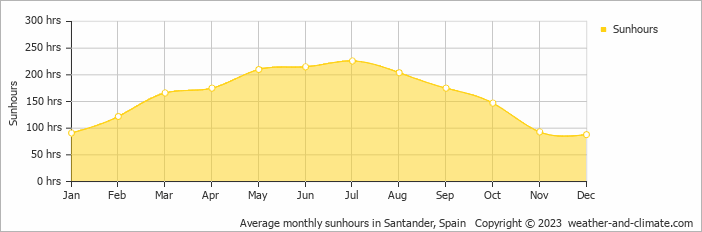
Sunshine Hours in Santillana del Mar
In Santillana del Mar, summer days are longer and more sunny, with daily sunshine hours peaking at 7.5 hours in July. As the darker season arrives, the brightness of the sun becomes less. December sees a soft sun for only 2.9 hours per average day.
Visit our detailed sunshine hours page for more information.
Monthly hours of sunshine
Daily hours of sunshine
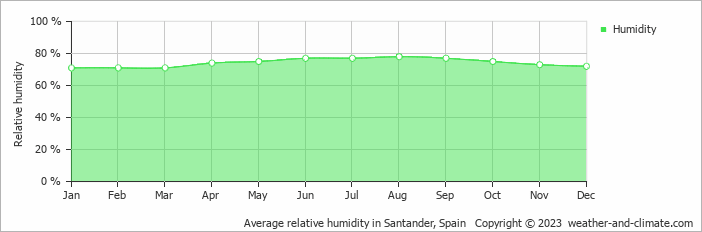
Humidity in Santillana del Mar by Month
The relative humidity is high throughout the year in Santillana del Mar.
The city experiences its highest humidity in August, reaching 78%. In January, the humidity drops to its lowest level at 71%. What does this mean? Read our detailed page on humidity levels for further details.
Relative humidity over the year
Best Time to Visit Santillana del Mar
The weather does bring rainfall during this period, between 70 mm (2.8 in) and 114 mm (4.5 in). Need help choosing your next travel destination? We offer a specialized tool that matches you with locations based on your weather preferences. Explore destinations that suit your climate preferences.
Frequently asked questions about the climate in Santillana del Mar
What is the best time to visit Santillana del Mar?
June, July, August and September typically offer the most optimal weather in Santillana del Mar. In contrast, January and February tend to have less optimal conditions.
What temperatures can I expect in Santillana del Mar?
Daytime highs range from 13°C (55°F) in February to 24°C (75°F) in August. Nighttime lows range from 6°C (43°F) to 17°C (63°F). Temperatures vary considerably through the year.
How much rain does Santillana del Mar get?
Annual rainfall is around 1252 mm (49 in). November is the wettest month with 149 mm (5.9 in), while July is the driest with 70 mm (2.8 in).
How sunny is Santillana del Mar?
Santillana del Mar receives around 1,912 hours of sunshine per year. July is the sunniest month with 226 hours, while December is the cloudiest with just 88 hours.
Santillana del Mar 3-Day Forecast
Santillana del Mar 3-Day Forecast
Santillana del Mar on the map
Santillana del Mar is highlighted — select any city to see its climate.
Popular this month
Where to go in July — average daytime high across popular destinations.
Bucket list
Need travel inspiration? Check out our bucket list articles and be inspired.
 El Hierro: The smallest Canary island without mass tourism
Mainly nature lovers and those seeking tranquility go to El Hierro. The island is know for its beautiful mountains and you can wonder around for days here.
Visit national Park El Teide
This national park is truly a unique place that you should not miss. You will find landscapes that seem to come from another plane and you will feel tiny in these impressive surroundings.
Sevilla: A Blend of Tradition, Culture, and Hidden Gems
Experience Sevilla in spring with Semana Santa processions and Feria de Abril festivities, set against the city's iconic landmarks and vibrant culture.
Enjoy an active trip in the mountains of Sierras de Cazorla
The mountains of Sierras de Cazorla offer spectacular views and sights and an abundance of activities that you can engage in, most of which are eco-friendly!