Puyo Weather & Climate: Best Time to Visit
Average temperatures, rainfall, sunshine and the best time to visit Puyo.
Climate overview of Puyo
The climate in Puyo, Chimborazo Province, Ecuador, is remarkably consistent, with temperatures year-round averaging 26°C (79°F). The warmest month is October at 27°C (81°F), and the coolest is August at 24°C (75°F).
The city has a wet climate, receiving around 2307 mm (91 in) of rainfall per year. Despite the high annual total, it has a distinct rainy season from November to June. April is the wettest month. Sunshine peaks in November, when the city sees around 3.5 hours of sunshine per day.
Puyo Weather by Month
Pick a month to see the average temperature, rainfall and sunshine in Puyo — and find the best time to visit.
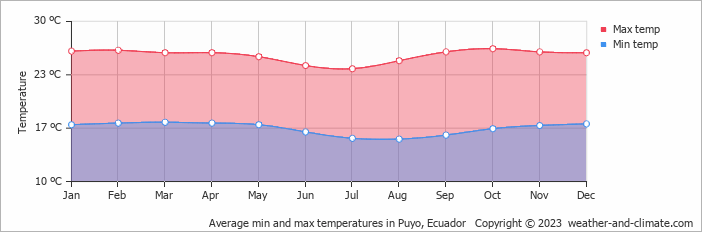
Monthly Temperature in Puyo
In Puyo temperatures are generally consistent throughout the year. On average, daytime temperatures range from a comfortable 27°C (81°F) in October to a comfortable 24°C (75°F) in August.
Nighttime temperatures range from 17°C (63°F) in October to 15°C (59°F) in August.
Check out our detailed temperature page for more information.
Temperature ranges by month
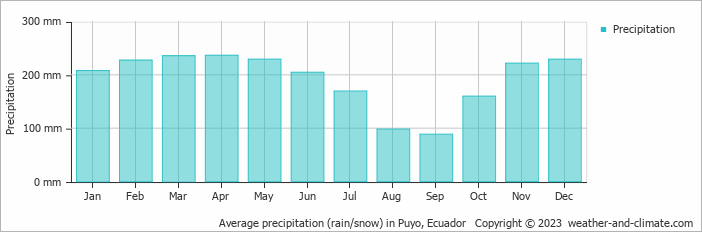
Rainfall in Puyo
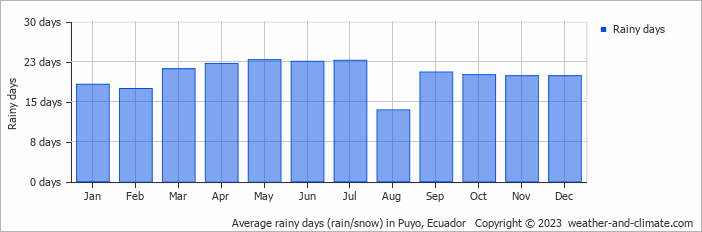
Puyo experiences significant rainfall throughout the year, averaging 2307 mm (91 in) of precipitation annually. The seasons in Puyo bring significant changes in precipitation. The wettest month, April, receives heavy rainfall, with an average of 236 mm (9.3 in) of precipitation. This rainfall is distributed across 22 rainy days.
In contrast, the driest month, September, experiences much less rainfall, totaling 88 mm (3.5 in) over 21 rainy days. These distinct seasonal differences provide diverse experiences throughout the year. For more details, please visit our Puyo Precipitation page.
The mean monthly precipitation over the year, including rain, hail, and snow
The average number of days each month with precipitation
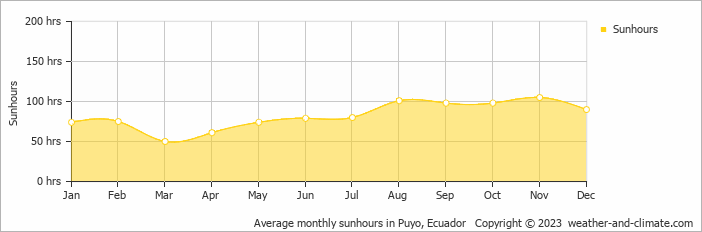
Sunshine Hours in Puyo
In Puyo, summer days are longer and more sunny, with daily sunshine hours peaking at 3.5 hours in November. As the darker season arrives, the brightness of the sun becomes less. March sees a soft sun for only 1.7 hours per average day.
Visit our detailed sunshine hours page for more information.
Monthly hours of sunshine
Daily hours of sunshine
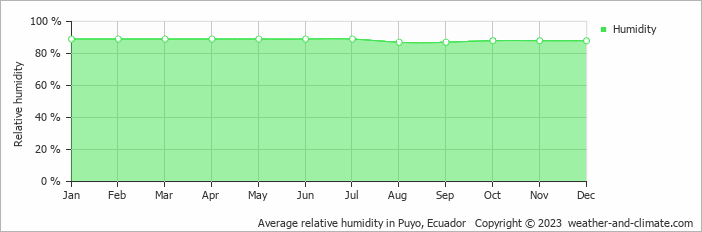
Humidity in Puyo by Month
The city experiences its highest humidity in January, reaching 89%. In August, the humidity drops to its lowest level at 87%. What does this mean? Read our detailed page on humidity levels for further details.
Relative humidity over the year
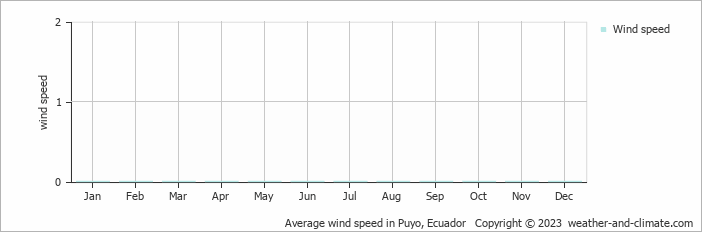
Wind Speed in Puyo
The mean wind speed varies between () and () throughout the year. It is lowest in January, February, March, April, May, June, July, August, September, October, November and December and highest during January, February, March, April, May, June, July, August, September, October, November and December. What does this mean?
The mean monthly wind speed over the year (meters per second)
Best Time to Visit Puyo
Frequently asked questions about the climate in Puyo
What is the best time to visit Puyo?
August and September typically offer the most optimal weather in Puyo. In contrast, January, February, March, April, May, June, November and December tend to have less optimal conditions. Puyo has a distinct rainy season from November to June.
What temperatures can I expect in Puyo?
Daytime highs range from 24°C (75°F) in August to 27°C (81°F) in October. Nighttime lows range from 15°C (59°F) to 17°C (63°F). Temperatures stay relatively stable year-round.
How much rain does Puyo get?
Annual rainfall is around 2307 mm (91 in). April is the wettest month with 236 mm (9.3 in), while September is the driest with 88 mm (3.5 in).
How sunny is Puyo?
Puyo receives around 985 hours of sunshine per year. November is the sunniest month with 105 hours, while March is the cloudiest with just 50 hours. Overcast skies are common, especially in winter.
Puyo 3-Day Forecast
Puyo 3-Day Forecast
Puyo on the map
Puyo is highlighted — select any city to see its climate.
Popular this month
Where to go in July — average daytime high across popular destinations.
Bucket list
Need travel inspiration? Check out our bucket list articles and be inspired.
 The 10 most alternative cities in South America
Discover South America's top 10 alternative cities! From Valparaíso's vibrant streets to La Paz's high-altitude charm and Medellín's innovative spirit.
 The Galapagos Islands
The Galapagos Islands is one of the most beautiful places on earth. If you want to see the origins of our planet with your own eyes, you should travel here.
A rain forest hotel in the clouds
This is not "just a lodge". It is a sanctuary of peace and nature for those who like to stay in the heart of nature with minimal environmental impact.