Puerto de la Madera Weather & Climate: Best Time to Visit
Average temperatures, rainfall, sunshine and the best time to visit Puerto de la Madera.
Climate overview of Puerto de la Madera
Puerto de la Madera, Spain, has a stable climate with little temperature variation across the year. Average daytime temperatures hover around 21°C (70°F), peaking in September at 23°C (73°F) and dipping in February to 18°C (64°F).
Rainfall is modest, totalling around 306 mm (12 in) annually. The city experiences a distinct dry season from January to December. December tends to be the wettest month. The sunniest month is July, with 11.1 hours of sunshine per day on average.
Puerto de la Madera Weather by Month
Pick a month to see the average temperature, rainfall and sunshine in Puerto de la Madera — and find the best time to visit.
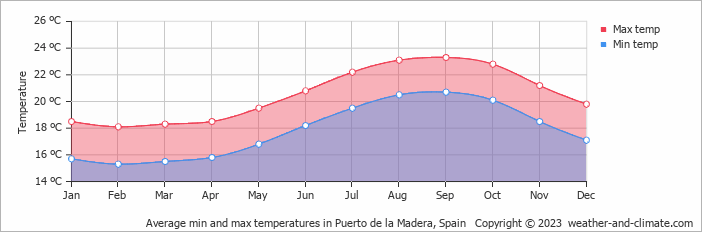
Monthly Temperature in Puerto de la Madera
With minimal seasonal shifts, Puerto de la Madera experiences a constant climate year-round. Average maximum daytime temperatures range from a comfortable 23°C (73°F) in September, the warmest time of the year, to a pleasant 18°C (64°F) during cooler months like February.
At night, you can expect temperatures ranging from 21°C (70°F) in September to around 15°C (59°F) during February.
Check out our detailed temperature page for more information.
Temperature ranges by month
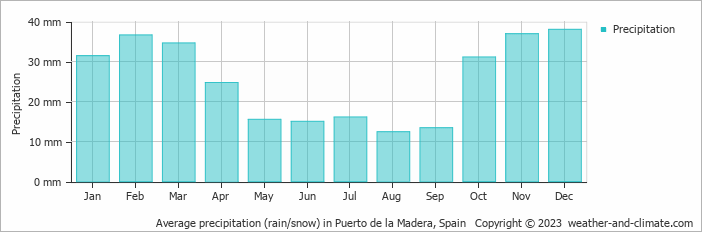
Rainfall in Puerto de la Madera
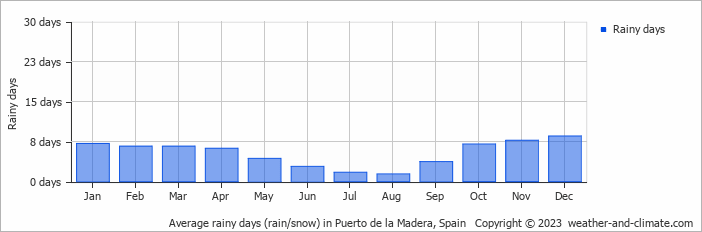
Puerto de la Madera has a relatively dry climate with low precipitation, averaging 306 mm (12 in) of rainfall annually. Significant seasonal changes in precipitation occur throughout the year. In the wettest month, December it receives moderate rainfall, averaging 38 mm (1.5 in) of precipitation, recorded across 9 rainy days. In contrast, the driest month August brings less rainfall, with 12 mm (0.5 in) over a single rainy day. For more details, please visit our Puerto de la Madera Precipitation page.
The mean monthly precipitation over the year, including rain, hail, and snow
The average number of days each month with precipitation
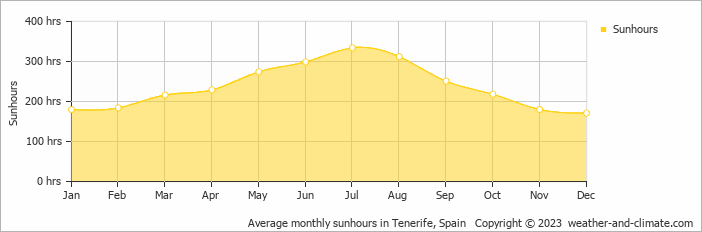
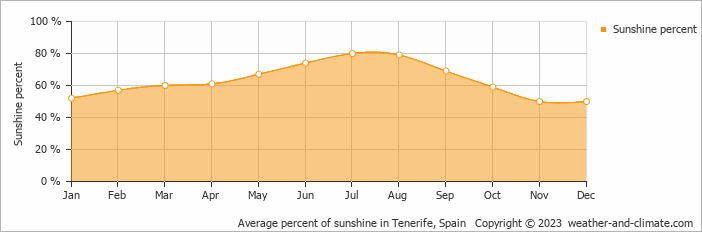
Sunshine Hours in Puerto de la Madera
Seasonal changes in sunshine hours are quite dramatic in Puerto de la Madera. While July receives considerable daily sunshine with up to 11.1 hours, December marks the darkest time of the year, where sunshine is scarce with only 5.7 hours of sunlight per day.
Visit our detailed sunshine hours page for more information.
Monthly hours of sunshine
Daily hours of sunshine
Daily percentage of sunshine
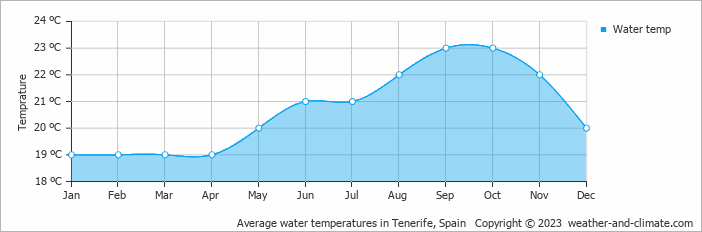
Water Temperature in Puerto de la Madera
The mean water temperature over the year ranges from 19°C (66°F) in January to 23°C (73°F) in September.
Water temperature over the year
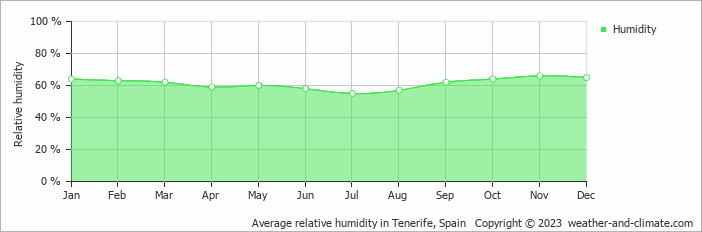
Humidity in Puerto de la Madera by Month
The relative humidity is high throughout the year in Puerto de la Madera.
The city experiences its highest humidity in November, reaching 66%. In July, the humidity drops to its lowest level at 55%. What does this mean? Read our detailed page on humidity levels for further details.
Relative humidity over the year
Best Time to Visit Puerto de la Madera
The varied rainfall (from 12 mm (0.5 in) to 38 mm (1.5 in)) creates diverse landscapes throughout the year. For the best outdoor conditions, plan your visit during the drier months like August. Looking for inspiration on where to travel this year? We have a tool that recommends destinations based on your ideal conditions. Find out where to go with our weather planner.
Frequently asked questions about the climate in Puerto de la Madera
What is the best time to visit Puerto de la Madera?
April, May, June, July, August, September, October, November and December typically offer the most optimal weather in Puerto de la Madera. In contrast, January, February and March tend to have less optimal conditions. Puerto de la Madera has a distinct dry season from January to December.
What temperatures can I expect in Puerto de la Madera?
Daytime highs range from 18°C (64°F) in February to 23°C (73°F) in September. Nighttime lows range from 15°C (59°F) to 21°C (70°F). Temperatures stay relatively stable year-round.
How much rain does Puerto de la Madera get?
Annual rainfall is around 306 mm (12 in). December is the wettest month with 38 mm (1.5 in), while August is the driest with 12 mm (0.5 in).
How sunny is Puerto de la Madera?
Puerto de la Madera receives around 2,848 hours of sunshine per year. July is the sunniest month with 334 hours, while December is the cloudiest with just 171 hours. Overall, Puerto de la Madera enjoys abundant sunshine.
Puerto de la Madera 3-Day Forecast
Puerto de la Madera 3-Day Forecast
Puerto de la Madera on the map
Puerto de la Madera is highlighted — select any city to see its climate.
Popular this month
Where to go in July — average daytime high across popular destinations.
Bucket list
Need travel inspiration? Check out our bucket list articles and be inspired.
 El Hierro: The smallest Canary island without mass tourism
Mainly nature lovers and those seeking tranquility go to El Hierro. The island is know for its beautiful mountains and you can wonder around for days here.
Visit national Park El Teide
This national park is truly a unique place that you should not miss. You will find landscapes that seem to come from another plane and you will feel tiny in these impressive surroundings.
Sevilla: A Blend of Tradition, Culture, and Hidden Gems
Experience Sevilla in spring with Semana Santa processions and Feria de Abril festivities, set against the city's iconic landmarks and vibrant culture.
Enjoy an active trip in the mountains of Sierras de Cazorla
The mountains of Sierras de Cazorla offer spectacular views and sights and an abundance of activities that you can engage in, most of which are eco-friendly!