Muri Weather & Climate: Best Time to Visit
Muri, Ngatangiia District, Cook Islands, has a stable climate with little temperature variation across the year. Average daytime temperatures hover around 26°C (79°F), peaking in February at 28°C (82°F) and dipping in August to 25°C (77°F).
The city has a wet climate, receiving around 1687 mm (66 in) of rainfall per year. Despite the high annual total, it has a distinct rainy season from December to March. January is the wettest month. Sunshine peaks in August, when the city sees around 6.4 hours of sunshine per day.
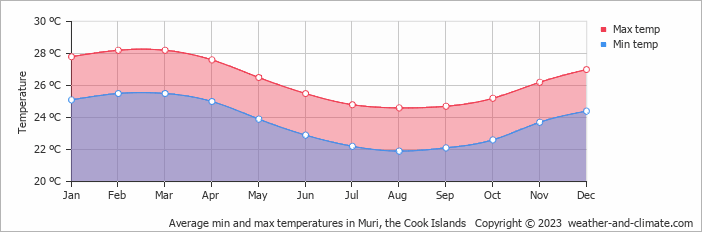
Monthly Temperature in Muri
With minimal seasonal shifts, Muri experiences a constant climate year-round. On average, daytime temperatures range from a comfortable 28°C (82°F) in February to a comfortable 25°C (77°F) in August.
Nighttime temperatures range from 26°C (79°F) in February to 22°C (72°F) in August.
Check out our detailed temperature page for more information.
Temperature ranges by month
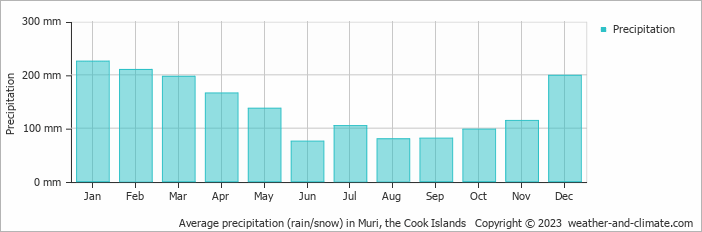
Rainfall in Muri
Muri has a notably wet climate with abundant precipitation, recording 1687 mm (66 in) of rainfall per year. The seasons in Muri bring significant changes in precipitation. The wettest month, January, receives heavy rainfall, with an average of 225 mm (8.9 in) of precipitation. This rainfall is distributed across 13 rainy days.
In contrast, the driest month, June, experiences much less rainfall, totaling 75 mm (3 in) over 11 rainy days. These distinct seasonal differences provide diverse experiences throughout the year. For more details, please visit our Muri Precipitation page.
The mean monthly precipitation over the year, including rain, hail, and snow
The average number of days each month with precipitation

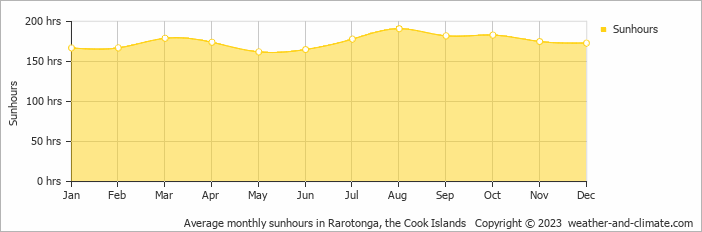
Sunshine Hours in Muri
The sunniest days in Muri occur in August, with around 6.4 hours of daily sunshine. Even in May, the least sunny month, Muri doesn't shy away from the sun, still enjoying a comfortable 5.4 hours of daily sunlight.
Visit our detailed sunshine hours page for more information.
Monthly hours of sunshine
Daily hours of sunshine
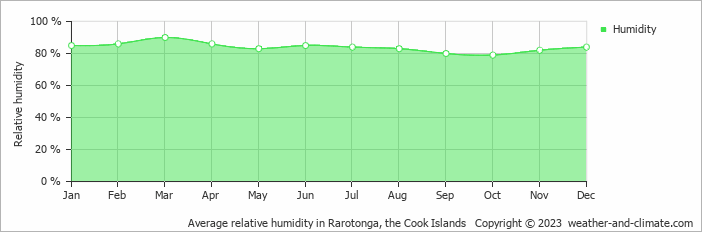
Humidity in Muri by Month
The city experiences its highest humidity in March, reaching 90%. In October, the humidity drops to its lowest level at 79%. What does this mean? Read our detailed page on humidity levels for further details.
Relative humidity over the year
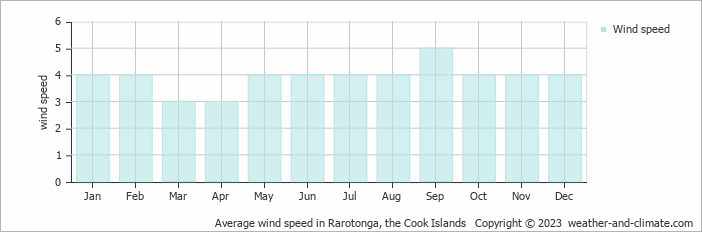
Wind Speed in Muri
The mean wind speed over the year ranges from 3 m/s (6 knots) in March and April to 5 m/s (10 knots) in September. What does this mean?
The mean monthly wind speed over the year (meters per second)
Muri 3-Day Forecast
Check the conditions for any month of the year.
Best Time to Visit Muri
Muri's weather is most enjoyable during May, June, July, August, September, October and November, with comfortable temperatures from 25°C (76°F) to 27°C (80°F). The moderate conditions ensure pleasant weather for exploring the area. Expect varied weather during this period with rainfall between 75 mm (3 in) and 137 mm (5.4 in), providing a good balance of sunny and rainy days.The wettest months are January, February, March, April and December, when precipitation is at its highest. Looking for inspiration on where to travel this year? We have a tool that recommends destinations based on your ideal conditions. Find out where to go with our weather planner.