Muizenberg Weather & Climate: Best Time to Visit
Average temperatures, rainfall, sunshine and the best time to visit Muizenberg.
Climate overview of Muizenberg
With consistently stable weather, Muizenberg, Western Cape, South Africa, sees little seasonal temperature change. Daytime highs average 19°C (66°F), ranging from 23°C (73°F) in February to 17°C (63°F) in July.
Muizenberg sees a moderate amount of rainfall, totalling around 637 mm (25 in) per year. It experiences a distinct dry season from October to March, creating some seasonal variation. The most sunshine falls in January, with an average of 11.3 hours of daily sunshine.
Muizenberg Weather by Month
Pick a month to see the average temperature, rainfall and sunshine in Muizenberg — and find the best time to visit.
Monthly Temperature in Muizenberg
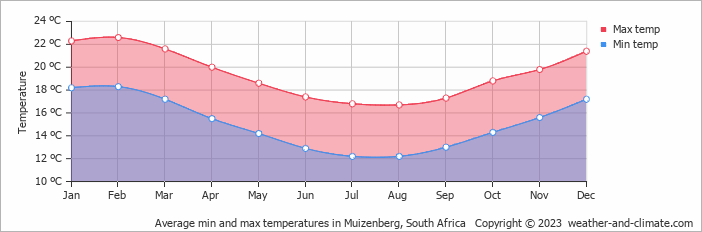
The climate in Muizenberg remains fairly constant, offering pleasant temperatures throughout the year. Average maximum daytime temperatures range from a comfortable 23°C (73°F) in February, the warmest time of the year, to a moderate 17°C (63°F) during cooler months like July.
At night, you can expect temperatures ranging from 18°C (64°F) in February to around 12°C (54°F) during July.
Check out our detailed temperature page for more information.
Temperature ranges by month
Rainfall in Muizenberg
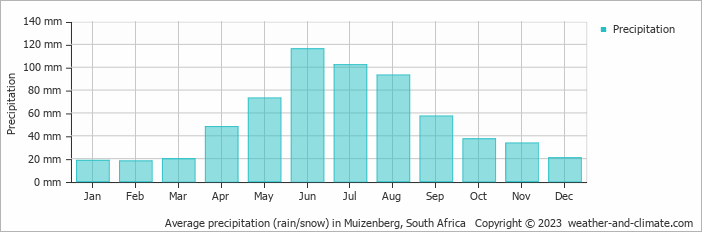
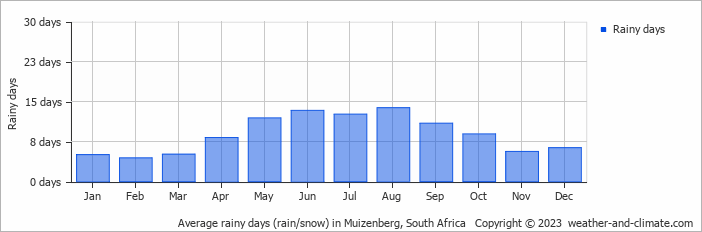
Generally, Muizenberg experiences moderate precipitation patterns, averaging 637 mm (25 in) yearly. Significant seasonal changes in precipitation occur throughout the year. In the wettest month, June it receives high rainfall, averaging 116 mm (4.6 in) of precipitation, recorded across 13 rainy days. In contrast, the driest month February brings less rainfall, with 18 mm (0.7 in) over 4 rainy days. For more details, please visit our Muizenberg Precipitation page.
The mean monthly precipitation over the year, including rain, hail, and snow
The average number of days each month with precipitation
Sunshine Hours in Muizenberg
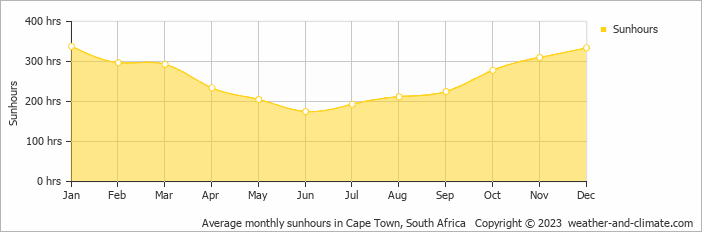
Seasonal changes in sunshine hours are quite dramatic in Muizenberg. While January receives considerable daily sunshine with up to 11.3 hours, June marks the darkest time of the year, where sunshine is scarce with only 5.8 hours of sunlight per day.
Visit our detailed sunshine hours page for more information.
Monthly hours of sunshine
Daily hours of sunshine
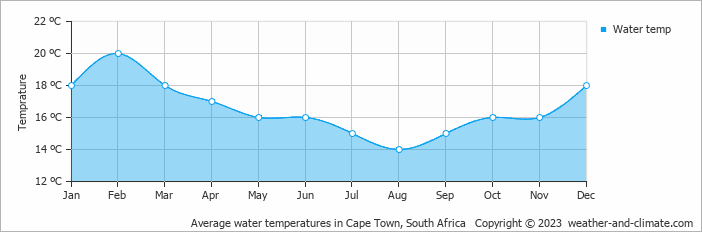
Water Temperature in Muizenberg
The mean water temperature over the year ranges from 14°C (57°F) in August to 20°C (68°F) in February.
Water temperature over the year
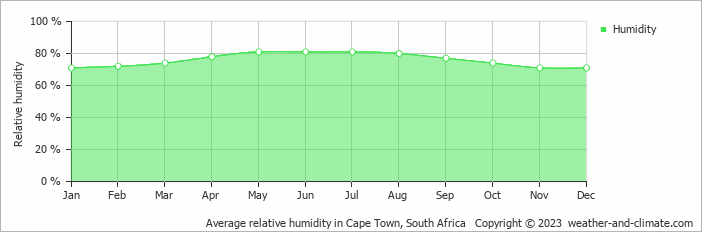
Humidity in Muizenberg by Month
The relative humidity is high throughout the year in Muizenberg.
The city experiences its highest humidity in May, reaching 81%. In January, the humidity drops to its lowest level at 71%. What does this mean? Read our detailed page on humidity levels for further details.
Relative humidity over the year
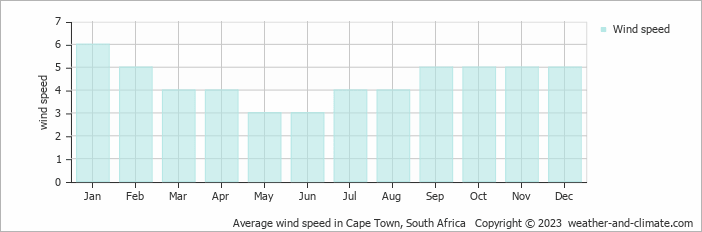
Wind Speed in Muizenberg
The mean wind speed varies between 3 m/s (6 knots) and 6 m/s (12 knots) throughout the year. It is lowest in May and June and highest during January. What does this mean?
The mean monthly wind speed over the year (meters per second)
Best Time to Visit Muizenberg
The weather does bring rainfall during this period, between 18 mm (0.7 in) and 48 mm (1.9 in). Need help choosing your next travel destination? We offer a specialized tool that matches you with locations based on your weather preferences. Explore destinations that suit your climate preferences.
Frequently asked questions about the climate in Muizenberg
What is the best time to visit Muizenberg?
January, February, March, April, November and December typically offer the most optimal weather in Muizenberg. In contrast, June and July tend to have less optimal conditions. Muizenberg has a distinct dry season from October to March.
What temperatures can I expect in Muizenberg?
Daytime highs range from 17°C (63°F) in July to 23°C (73°F) in February. Nighttime lows range from 12°C (54°F) to 18°C (64°F). Temperatures stay relatively stable year-round.
How much rain does Muizenberg get?
Annual rainfall is around 637 mm (25 in). June is the wettest month with 116 mm (4.6 in), while February is the driest with 18 mm (0.7 in).
How sunny is Muizenberg?
Muizenberg receives around 3,094 hours of sunshine per year. January is the sunniest month with 338 hours, while June is the cloudiest with just 175 hours. Overall, Muizenberg enjoys abundant sunshine.
Muizenberg 3-Day Forecast
Muizenberg 3-Day Forecast
Muizenberg on the map
Muizenberg is highlighted — select any city to see its climate.
Popular this month
Where to go in July — average daytime high across popular destinations.
Bucket list
Need travel inspiration? Check out our bucket list articles and be inspired.
 Visit Kruger Park in South Africa
Are you going to South Africa, then you cannot skip the Kruger Park. The Kruger Park is one of the most beautiful and largest safari parks in the world.
One of South Africa's most spectacular private game reserves
Sabi Sand Game Reserve is one of South Africa's most spectacular private game reserves. The chance that you see the entire Big Five is high in winter (June - August).
Stay in the world's largest open-air gallery
Vast mountains, beautiful nature, tranquility and the possibility of hiking and seeing fascinating rock paintings. This can all be experienced at the Cederberg Mountains.
Kwazulu Natal
Countless beautiful landscapes, a colorful collection of cultures, wildlife parks, busy and deserted beaches, lively cities, small villages and a subtropical climate.