Mosman Weather & Climate: Best Time to Visit
Average temperatures, rainfall, sunshine and the best time to visit Mosman.
Climate overview of Mosman
Mosman, New South Wales, Australia, experiences moderate temperature changes through the seasons. January is the warmest month with daytime highs of 26°C (79°F), while July is the coolest at 18°C (64°F).
With around 926 mm (36 in) of annual rainfall, the city has moderate precipitation levels. February is the wettest month and September the driest. The most sunshine falls in December, with an average of 8.6 hours of daily sunshine.
Mosman Weather by Month
Pick a month to see the average temperature, rainfall and sunshine in Mosman — and find the best time to visit.
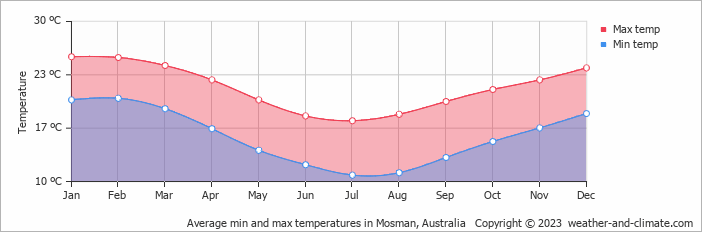
Monthly Temperature in Mosman
The climate in Mosman experiences moderate temperature changes, with mild shifts between seasons. Typically, average maximum daytime temperatures range from a comfortable 26°C (79°F) in January to a moderate 18°C (64°F) in the coolest month, July.
Nights vary from 20°C (68°F) in January to around 11°C (52°F) during the colder months.
Check out our detailed temperature page for more information.
Temperature ranges by month
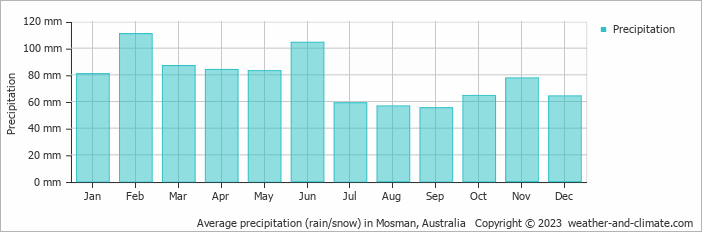
Rainfall in Mosman
Generally, Mosman has a moderate amount of precipitation, averaging 926 mm (36 in) of rainfall annually. Mosman offers a pleasant mix of wetter and slightly drier months. The difference in precipitation between the wettest month February (111 mm (4.4 in)) and the driest month September (55 mm (2.2 in)) is not too significant. For more details, please visit our Mosman Precipitation page.
The mean monthly precipitation over the year, including rain, hail, and snow
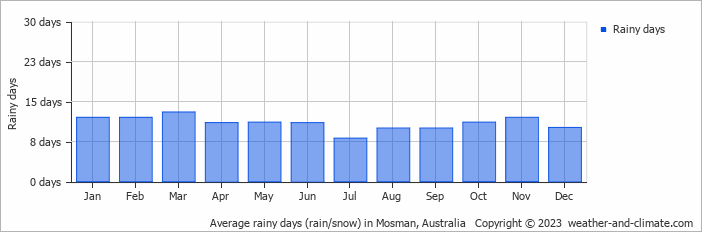
The average number of days each month with precipitation
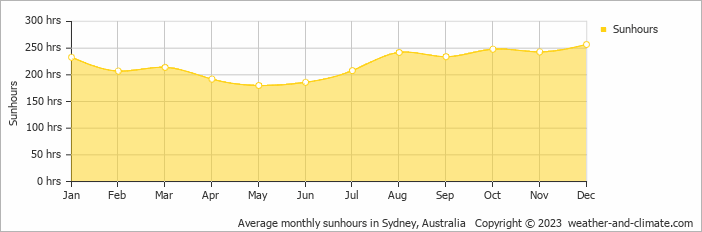
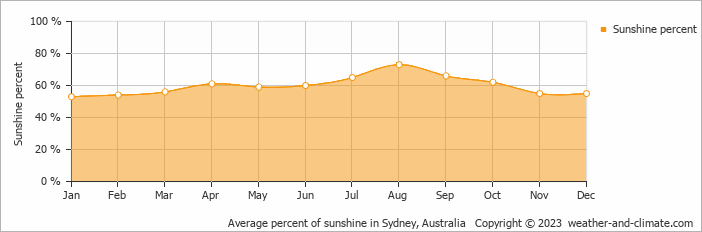
Sunshine Hours in Mosman
Mosman offers a pleasant mix of sunny and slightly overcast days. The difference in sunshine hours between December (8.6 hours daily) and May (6.0 hours daily) provides a bit of variety for visitors and residents.
Visit our detailed sunshine hours page for more information.
Monthly hours of sunshine
Daily hours of sunshine
Daily percentage of sunshine
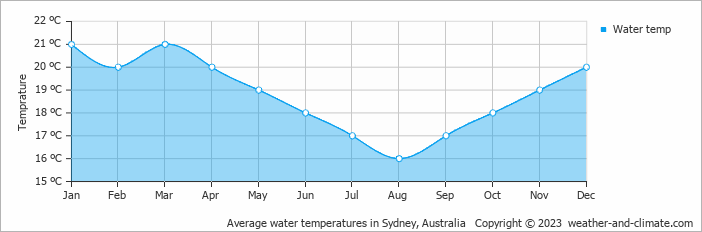
Water Temperature in Mosman
The mean water temperature over the year ranges from 16°C (61°F) in August to 21°C (70°F) in January.
Water temperature over the year
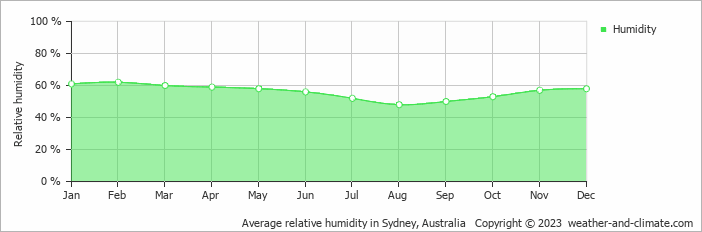
Humidity in Mosman by Month
The relative humidity is moderate throughout the year in Mosman.
The city experiences its highest humidity in February, reaching 62%. In August, the humidity drops to its lowest level at 48%. What does this mean? Read our detailed page on humidity levels for further details.
Relative humidity over the year
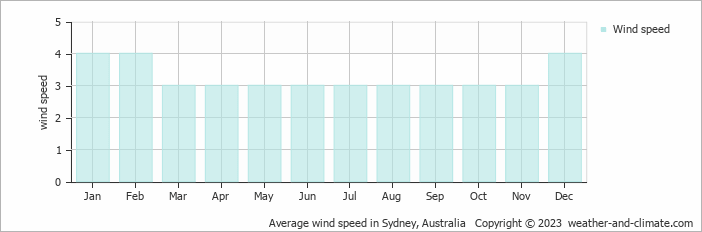
Wind Speed in Mosman
The mean wind speed over the year ranges from 3 m/s (6 knots) in March, April, May, June, July, August and September to 4 m/s (8 knots) in October. What does this mean?
The mean monthly wind speed over the year (meters per second)
Best Time to Visit Mosman
Rainfall during this time ranges from 55 mm (2.2 in) in September to 111 mm (4.4 in) in February. This means you can expect a mix of sunny days and occasional showers. Planning your next adventure but unsure where to go? Our climate tool suggests perfect locations tailored to your preferred weather conditions. Discover your ideal travel destination with our weather planner.
Frequently asked questions about the climate in Mosman
What is the best time to visit Mosman?
January, March, April, May, September, October, November and December typically offer the most optimal weather in Mosman. In contrast, June tends to have less optimal conditions.
What temperatures can I expect in Mosman?
Daytime highs range from 18°C (64°F) in July to 26°C (79°F) in January. Nighttime lows range from 11°C (52°F) to 20°C (68°F).
How much rain does Mosman get?
Annual rainfall is around 926 mm (36 in). February is the wettest month with 111 mm (4.4 in), while September is the driest with 55 mm (2.2 in).
How sunny is Mosman?
Mosman receives around 2,644 hours of sunshine per year. December is the sunniest month with 257 hours, while May is the cloudiest with just 180 hours. Overall, Mosman enjoys abundant sunshine.
Mosman 3-Day Forecast
Mosman 3-Day Forecast
Mosman on the map
Mosman is highlighted — select any city to see its climate.
Popular this month
Where to go in July — average daytime high across popular destinations.
Bucket list
Need travel inspiration? Check out our bucket list articles and be inspired.
 An alternative way to discover Sydney
We have made an overview of the sights in Sydney that you must see if you want to visit Sydney in an alternative way.
The most relaxed and alternative area of Australia is called the Byron Shire
The Byron Shire is one of the most pretty areas in the world. Not only in terms on natural beauty, also the relaxed vibe and people make this an area that remains close to your heart.
Sail the Whitsunday islands
The best travel period to sail the Whitsunday islands is “winter” between June and October, with pleasant temperatures around 23 degrees Celsius (74 Fahrenheit).
The best dive spots in Australia
Explore Australia's best dive spots: from the Great Barrier Reef to HMAS Perth. Discover vibrant corals, marine life, and historic wrecks.