Moira Weather & Climate: Best Time to Visit
Average temperatures, rainfall, sunshine and the best time to visit Moira.
Climate overview of Moira
Moira, Down County, United Kingdom, has a moderate seasonal temperature range, with July reaching 20°C (68°F) and January cooling to 9°C (48°F).
The city receives around 952 mm (37 in) of rainfall per year. August is the wettest month and March the driest. The sunniest month is May, with 6.1 hours of sunshine per day on average.
Moira Weather by Month
Pick a month to see the average temperature, rainfall and sunshine in Moira — and find the best time to visit.
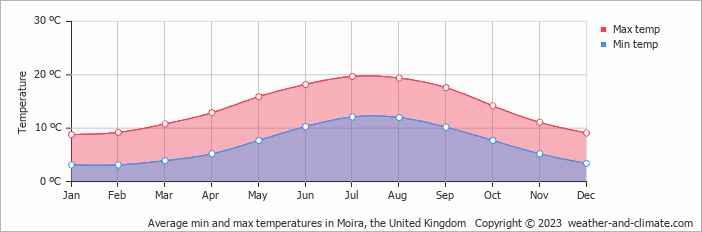
Monthly Temperature in Moira
The weather in Moira changes moderately throughout the year, offering enough variation to appreciate each season. On average, daytime temperatures range from a pleasant 20°C (68°F) in July to a chilly 9°C (48°F) in January.
Nighttime temperatures range from 12°C (54°F) in July to 3°C (37°F) in January.
Check out our detailed temperature page for more information.
Temperature ranges by month
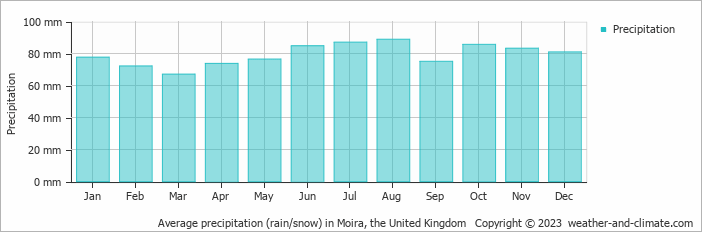
Rainfall in Moira
Generally, Moira experiences moderate precipitation patterns, averaging 952 mm (37 in) yearly. The wettest period in Moira occurs in August, which receives around 89 mm (3.5 in) of precipitation. During the driest month, March, Moira experiences moderate rainfall, totaling 67 mm (2.6 in). The consistent precipitation levels throughout the year contribute to a relatively stable climate. For more details, please visit our Moira Precipitation page.
The mean monthly precipitation over the year, including rain, hail, and snow
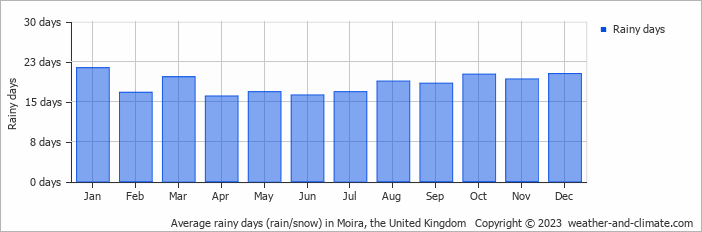
The average number of days each month with precipitation
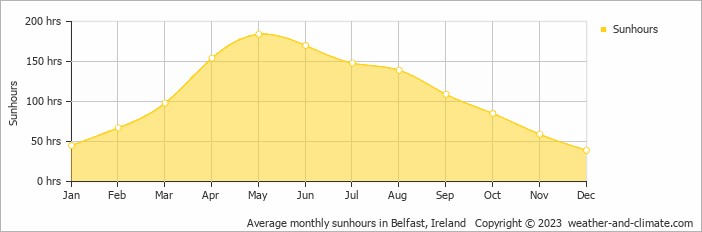
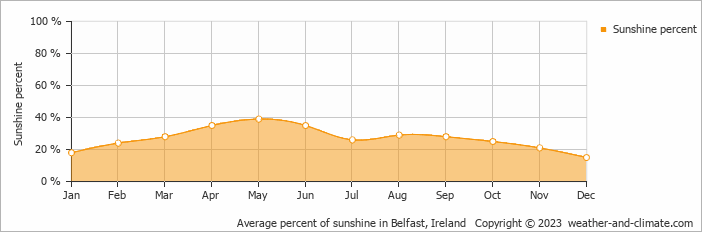
Sunshine Hours in Moira
In Moira, summer days are longer and more sunny, with daily sunshine hours peaking at 6.1 hours in May. As the darker season arrives, the brightness of the sun becomes less. December sees a soft sun for only 1.3 hours per average day.
Visit our detailed sunshine hours page for more information.
Monthly hours of sunshine
Daily hours of sunshine
Daily percentage of sunshine
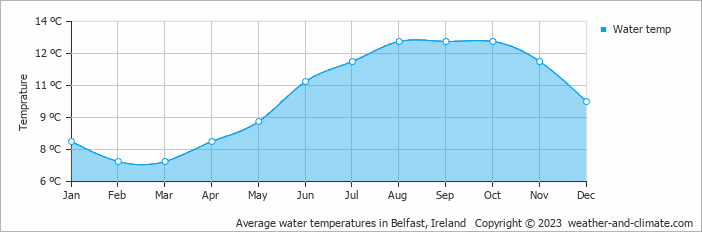
Water Temperature in Moira
The mean water temperature over the year ranges from 7°C (45°F) in February to 13°C (55°F) in August.
Water temperature over the year
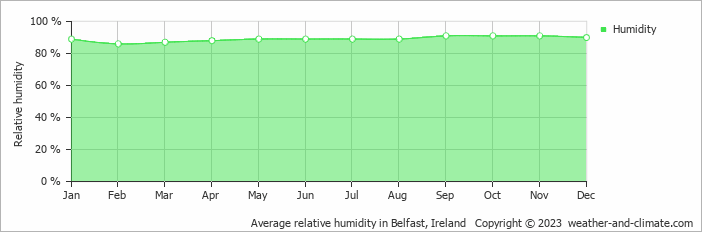
Humidity in Moira by Month
The city experiences its highest humidity in September, reaching 91%. In February, the humidity drops to its lowest level at 86%. What does this mean? Read our detailed page on humidity levels for further details.
Relative humidity over the year
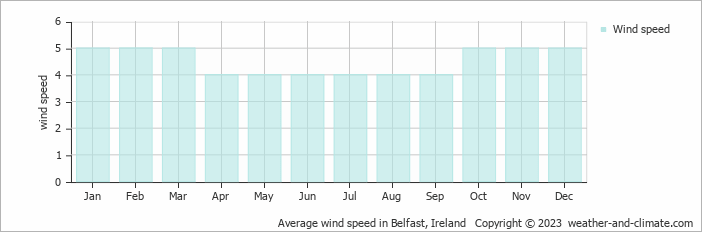
Wind Speed in Moira
The mean wind speed varies between 4 m/s (8 knots) and 5 m/s (10 knots) throughout the year. It is lowest in April, May, June, July, August and September and highest during January, February, March, October, November and December. What does this mean?
The mean monthly wind speed over the year (meters per second)
Best Time to Visit Moira
The weather does bring rainfall during this period, between 85 mm (3.3 in) and 89 mm (3.5 in). Seeking the perfect travel destination for this year? We've created a tool that suggests locations matching your desired weather. Let our weather planner guide your travel decisions.
Frequently asked questions about the climate in Moira
What is the best time to visit Moira?
July typically offers the most optimal weather in Moira. In contrast, January, February and December tend to have less optimal conditions.
What temperatures can I expect in Moira?
Daytime highs range from 9°C (48°F) in January to 20°C (68°F) in July. Nighttime lows range from 3°C (37°F) to 12°C (54°F).
How much rain does Moira get?
Annual rainfall is around 952 mm (37 in). August is the wettest month with 89 mm (3.5 in), while March is the driest with 67 mm (2.6 in).
How sunny is Moira?
Moira receives around 1,297 hours of sunshine per year. May is the sunniest month with 184 hours, while December is the cloudiest with just 39 hours.
Moira 3-Day Forecast
Moira 3-Day Forecast
Moira on the map
Moira is highlighted — select any city to see its climate.
Popular this month
Where to go in July — average daytime high across popular destinations.
Bucket list
Need travel inspiration? Check out our bucket list articles and be inspired.
 Hike the South West Coast Path
The South West Coast Path means breathtaking nature, kind people and delicious food everywhere you go. It is an unforgettable experience and you need to add it to your bucket list.
Welcome to Totnes, the hidden treasure of South Devon
Totnes is a place where historical richness fuses effortlessly with a vibrant alternative culture and breathtaking natural surroundings. The town pulses with an amazing community spirit that you'll feel around every corner.
London's coolest neighborhoods you'll want to visit
Discover the 6 coolest neighborhoods in London for your trip! Explore vibrant Shoreditch, lively Soho, alternative Camden, and many more.
10 cities you should definitely visit in the UK
Discover the top 10 most fun and alternative cities in the UK, rich in art, culture, and adventure. Explore vibrant neighborhoods and unique places.