Moclinejo Weather & Climate: Best Time to Visit
Average temperatures, rainfall, sunshine and the best time to visit Moclinejo.
Climate overview of Moclinejo
Moclinejo, Andalucía, Spain, sees big temperature differences between seasons, with August peaking at 28°C (82°F) and January dropping to 15°C (59°F).
The city tends toward dry conditions, with around 483 mm (19 in) of rainfall per year. It does, however, have a distinct dry season from May to September. Sunshine peaks in July, when the city sees around 11.6 hours of sunshine per day.
Moclinejo Weather by Month
Pick a month to see the average temperature, rainfall and sunshine in Moclinejo — and find the best time to visit.
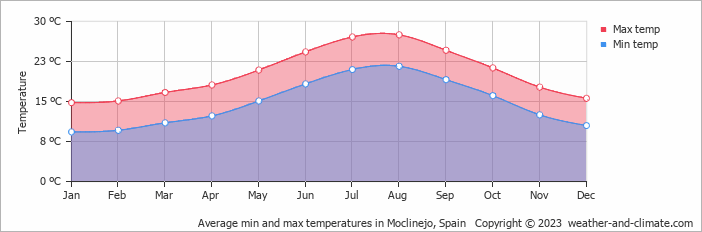
Monthly Temperature in Moclinejo
Visitors to Moclinejo can expect significant temperature changes throughout the year. Typically, average maximum daytime temperatures range from a comfortable 28°C (82°F) in August to a moderate 15°C (59°F) in the coolest month, January.
Nights vary from 22°C (72°F) in August to around 9°C (48°F) during the colder months.
Check out our detailed temperature page for more information.
Temperature ranges by month
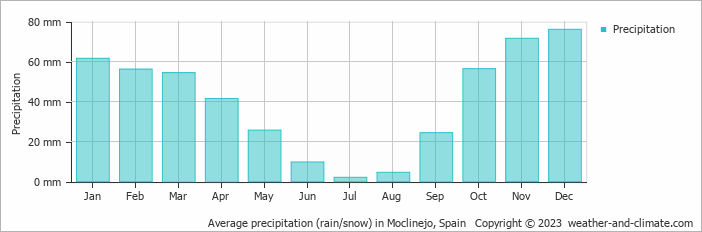
Rainfall in Moclinejo
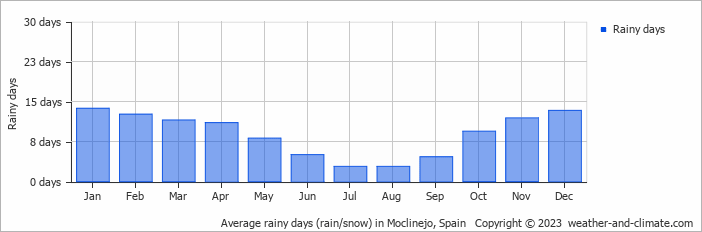
Moclinejo tends toward drier weather patterns, receiving approximately 483 mm (19 in) of rain per year. The climate in Moclinejo shows significant variation throughout the year. Expect moderate rainfall in December, the wettest month, with an average of 76 mm (3 in) of precipitation over 13 rainy days.
In contrast, the driest month July offers drier and sunnier days, with around 2 mm (0.1 in) of rainfall over 3 rainy days. For more details, please visit our Moclinejo Precipitation page.
The mean monthly precipitation over the year, including rain, hail, and snow
The average number of days each month with precipitation
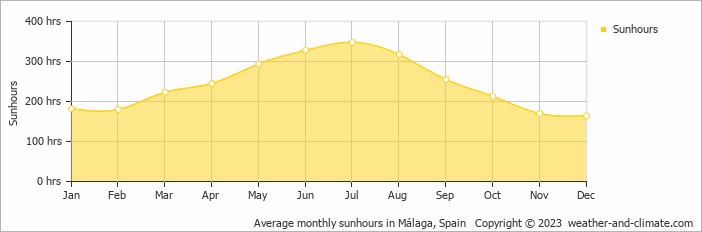
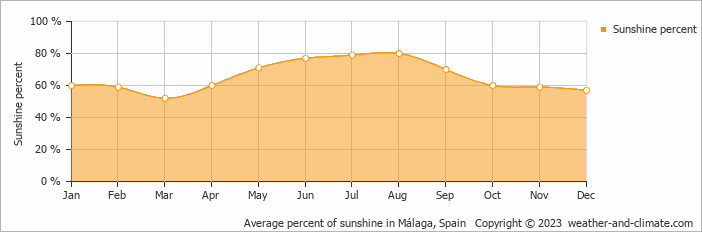
Sunshine Hours in Moclinejo
For those who appreciate different seasons, Moclinejo serves as an ideal destination. Expect longer, more sun-filled days in July with an average of 11.6 hours of sunshine daily, and embrace the darker days in December, offering only 5.5 hours of daily sunlight.
Visit our detailed sunshine hours page for more information.
Monthly hours of sunshine
Daily hours of sunshine
Daily percentage of sunshine
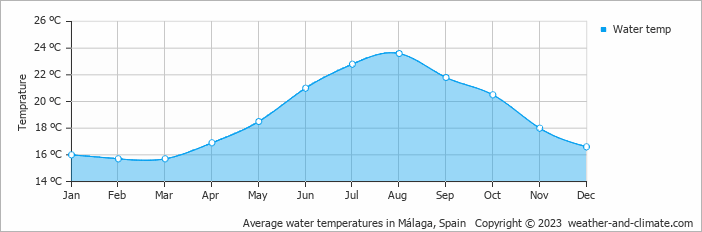
Water Temperature in Moclinejo
The mean water temperature over the year ranges from 16°C (61°F) in February to 24°C (75°F) in August.
Water temperature over the year
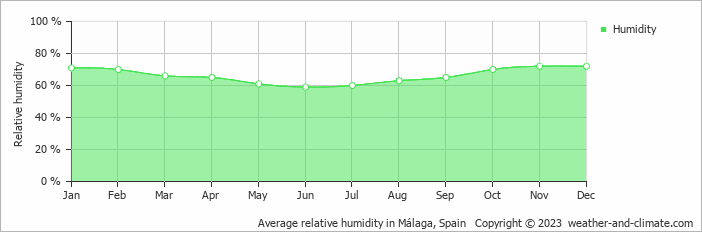
Humidity in Moclinejo by Month
The relative humidity is high throughout the year in Moclinejo.
The city experiences its highest humidity in November, reaching 72%. In June, the humidity drops to its lowest level at 59%. What does this mean? Read our detailed page on humidity levels for further details.
Relative humidity over the year
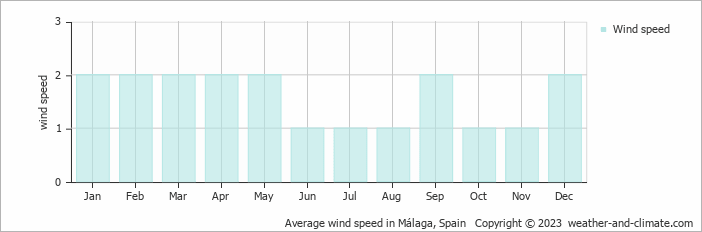
Wind Speed in Moclinejo
The mean wind speed over the year ranges from 1 m/s (2 knots) in June, July, August, October and November to 2 m/s (4 knots) in January, February, March, April, May, September and December. What does this mean?
The mean monthly wind speed over the year (meters per second)
Best Time to Visit Moclinejo
The weather does bring rainfall during this period, between 2 mm (0.1 in) and 56 mm (2.2 in). Wondering where to travel based on your weather preferences? Our recommendation tool helps you find destinations with your ideal climate conditions. Use our weather planner to find your perfect destination.
Frequently asked questions about the climate in Moclinejo
What is the best time to visit Moclinejo?
May, June, July, August, September and October typically offer the most optimal weather in Moclinejo. In contrast, January, February, March and December tend to have less optimal conditions. Moclinejo has a distinct dry season from May to September.
What temperatures can I expect in Moclinejo?
Daytime highs range from 15°C (59°F) in January to 28°C (82°F) in August. Nighttime lows range from 9°C (48°F) to 22°C (72°F). Temperatures vary considerably through the year.
How much rain does Moclinejo get?
Annual rainfall is around 483 mm (19 in). December is the wettest month with 76 mm (3 in), while July is the driest with 2 mm (0.1 in).
How sunny is Moclinejo?
Moclinejo receives around 2,919 hours of sunshine per year. July is the sunniest month with 348 hours, while December is the cloudiest with just 164 hours. Overall, Moclinejo enjoys abundant sunshine.
Moclinejo 3-Day Forecast
Moclinejo 3-Day Forecast
Moclinejo on the map
Moclinejo is highlighted — select any city to see its climate.
Popular this month
Where to go in July — average daytime high across popular destinations.
Bucket list
Need travel inspiration? Check out our bucket list articles and be inspired.
 El Hierro: The smallest Canary island without mass tourism
Mainly nature lovers and those seeking tranquility go to El Hierro. The island is know for its beautiful mountains and you can wonder around for days here.
Visit national Park El Teide
This national park is truly a unique place that you should not miss. You will find landscapes that seem to come from another plane and you will feel tiny in these impressive surroundings.
Sevilla: A Blend of Tradition, Culture, and Hidden Gems
Experience Sevilla in spring with Semana Santa processions and Feria de Abril festivities, set against the city's iconic landmarks and vibrant culture.
Enjoy an active trip in the mountains of Sierras de Cazorla
The mountains of Sierras de Cazorla offer spectacular views and sights and an abundance of activities that you can engage in, most of which are eco-friendly!