Malargüe Weather & Climate: Best Time to Visit
Average temperatures, rainfall, sunshine and the best time to visit Malargüe.
Climate overview of Malargüe
Malargüe, Mendoza Province, Argentina, experiences significant temperature variation throughout the year. Summers bring daytime highs of 26°C (79°F) in January, while winters cool to 6°C (43°F) in July.
Malargüe sees a moderate amount of rain/snowfall, totalling around 710 mm (28 in) per year. It experiences warm summers and cold winters, creating some seasonal variation. The sunniest month is January, with 10.9 hours of sunshine per day on average.
Malargüe Weather by Month
Pick a month to see the average temperature, rainfall and sunshine in Malargüe - and find the best time to visit.
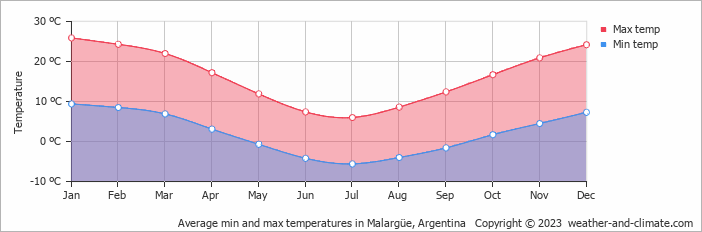
Monthly Temperature in Malargüe
Depending on the time of the year, temperatures range from comfortable to chilly in Malargüe. Average maximum daytime temperatures range from a comfortable 26°C (79°F) in January, the warmest time of the year, to a chilly 6°C (43°F) during cooler months like July.
At night, you can expect temperatures ranging from 9°C (48°F) in January to around -6°C (21°F) during July.
Check out our detailed temperature page for more information.
Temperature ranges by month
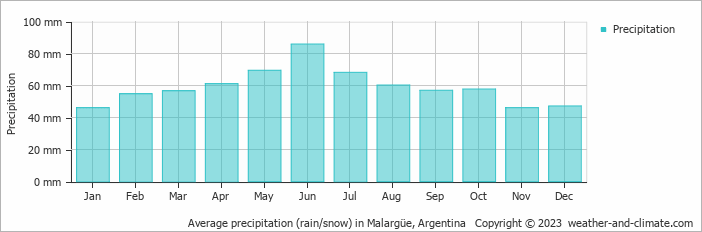
Rainfall in Malargüe
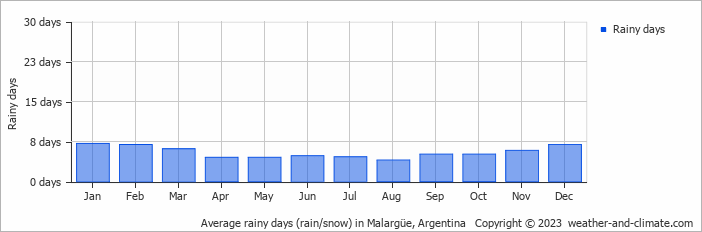
Generally, Malargüe has a moderate amount of precipitation, averaging 710 mm (28 in) of rain/snowfall annually. While snow/rainfall varies throughout the year, each season offers its own charm. June brings wetter days averaging 86 mm (3.4 in) of precipitation, spread over 5 snowy/rainy days.
In contrast, the driest month January experiences a drier climate, with about 46 mm (1.8 in) of rainfall spread across 7 rainy days. For more details, please visit our Malargüe Precipitation page.
The mean monthly precipitation over the year, including rain, hail, and snow
The average number of days each month with precipitation
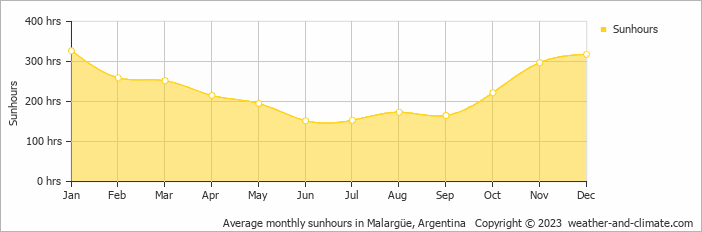
Sunshine Hours in Malargüe
Seasonal changes in sunshine hours are quite dramatic in Malargüe. While January receives considerable daily sunshine with up to 10.9 hours, June marks the darkest time of the year, where sunshine is scarce with only 5.1 hours of sunlight per day.
Visit our detailed sunshine hours page for more information.
Monthly hours of sunshine
Daily hours of sunshine
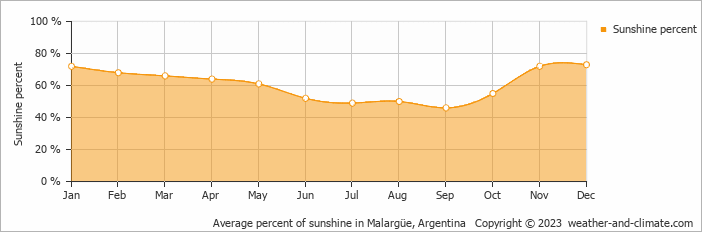
Daily percentage of sunshine
Humidity in Malargüe by Month
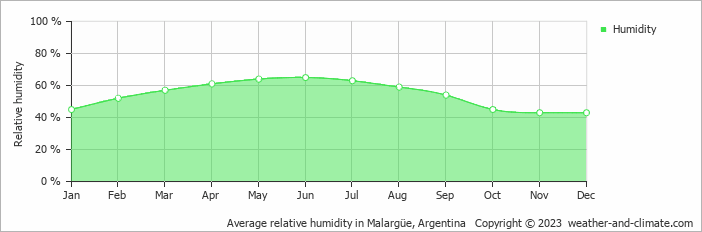
The relative humidity is moderate throughout the year in Malargüe.
The city experiences its highest humidity in June, reaching 65%. In November, the humidity drops to its lowest level at 43%. What does this mean? Read our detailed page on humidity levels for further details.
Relative humidity over the year
Wind Speed in Malargüe
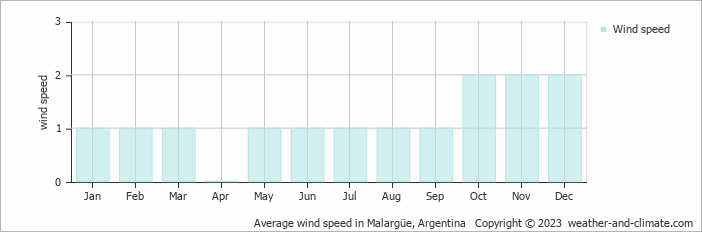
The mean wind speed varies between () and 2 m/s (4 knots) throughout the year. It is lowest in April and highest during October, November and December. What does this mean?
The mean monthly wind speed over the year (meters per second)
Best Time to Visit Malargüe
Monthly ratings reflect general weather comfort, based on daytime temperature and rainfall. Swimming and winter conditions are highlighted separately where relevant.
- Best overall: January, February, March, November and December
- Warmest weather: January
- Most sunshine: January and December
- Seasonal pattern: Warm summers and cold winters
- Coldest conditions: July, with freezing nights around -6°C (21°F).
Frequently asked questions about the climate in Malargüe
What is the best time to visit Malargüe?
January, February, March, November and December typically offer the most optimal weather in Malargüe. In contrast, June, July and August tend to have less optimal conditions. Malargüe has warm summers and cold winters.
What temperatures can I expect in Malargüe?
Daytime highs range from 6°C (43°F) in July to 26°C (79°F) in January. Nighttime lows range from -6°C (21°F) to 9°C (48°F). Temperatures vary considerably through the year.
How much rain does Malargüe get?
Annual rainfall is around 710 mm (28 in). June is the wettest month with 86 mm (3.4 in), while January is the driest with 46 mm (1.8 in). In the coldest months, precipitation may fall as snow/rain.
How sunny is Malargüe?
Malargüe receives around 2,728 hours of sunshine per year. January is the sunniest month with 327 hours, while June is the cloudiest with just 152 hours. Overall, Malargüe enjoys abundant sunshine.
Malargüe 3-Day Forecast
Malargüe 3-Day Forecast
Malargüe on the map
Malargüe is highlighted - select any city to see its climate.
Popular this month
Where to go in July - average daytime high across popular destinations.
Bucket list
Need travel inspiration? Check out our bucket list articles and be inspired.
 The 10 most alternative cities in South America
Discover South America's top 10 alternative cities! From Valparaíso's vibrant streets to La Paz's high-altitude charm and Medellín's innovative spirit.
Be amazed by Buenos Aires
The city of beautiful museums, cute streets, green parks, lots of good food, interesting local neighborhoods and impressive historical buildings.
Explore Patagonia
A tour through Patagonia brings you to the end of the world. That’s why Patagonia is a bucket list destination for many. We recommend to visit Patagonia from November to early March.
Glacier walk on The Perito Moreno glacier
The Perito Moreno glacier and the rupture of this glacier is considered one of the most impressive natural spectacles in the world. You can wait here until a large piece of ice crumbles and plunges into the water with a lot of noise.