Leura Weather & Climate: Best Time to Visit
Average temperatures, rainfall, sunshine and the best time to visit Leura.
Climate overview of Leura
Leura, New South Wales, Australia, sees big temperature differences between seasons, with January peaking at 27°C (81°F) and July dropping to 14°C (57°F).
With around 1043 mm (41 in) of annual rainfall, Leura has a notably wet climate. The wettest month is February.
Leura Weather by Month
Pick a month to see the average temperature, rainfall and sunshine in Leura — and find the best time to visit.
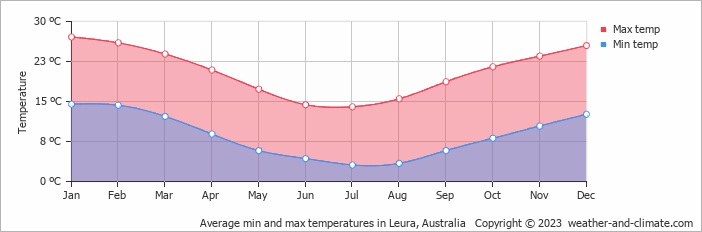
Monthly Temperature in Leura
Visitors to Leura can expect significant temperature changes throughout the year. Average daytime temperatures reach a comfortable 27°C (81°F) in January. In July, the coolest month of the year, temperatures drop to a moderate 14°C (57°F).
At night, temperatures range from around 15°C (59°F) in January to 3°C (37°F) in July.
Check out our detailed temperature page for more information.
Temperature ranges by month
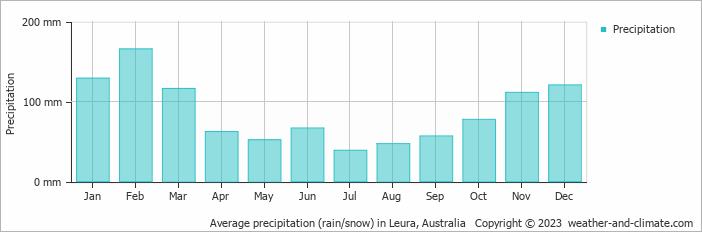
Rainfall in Leura
Leura is known for its substantial rainfall, with annual precipitation reaching 1043 mm (41 in). Leura can be quite wet during February, receiving approximately 166 mm (6.5 in) of precipitation over 12 rainy days.
In contrast, during the driest month (July), you will experience much drier conditions, with 39 mm (1.5 in) of precipitation spread across 9 rainy days. For more details, please visit our Leura Precipitation page.
The mean monthly precipitation over the year, including rain, hail, and snow
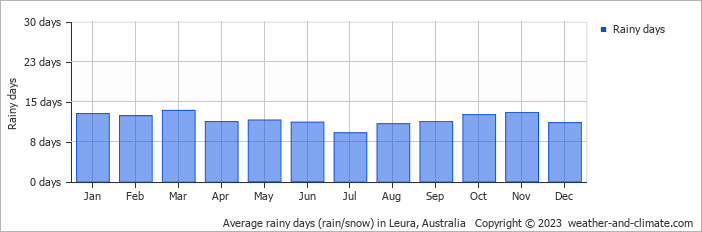
The average number of days each month with precipitation
Best Time to Visit Leura
The weather does bring rainfall during this period, between 57 mm (2.2 in) and 129 mm (5.1 in).
Plan accordingly for February, when conditions bring the heaviest precipitation. Ready to plan your travels but need destination ideas? Our smart tool recommends places based on the climate conditions you prefer. Start planning with our destination weather tool.
Frequently asked questions about the climate in Leura
What is the best time to visit Leura?
April and October typically offer the most optimal weather in Leura. In contrast, May, June, July and August tend to have less optimal conditions.
What temperatures can I expect in Leura?
Daytime highs range from 14°C (57°F) in July to 27°C (81°F) in January. Nighttime lows range from 3°C (37°F) to 15°C (59°F). Temperatures vary considerably through the year.
How much rain does Leura get?
Annual rainfall is around 1043 mm (41 in). February is the wettest month with 166 mm (6.5 in), while July is the driest with 39 mm (1.5 in).
Leura 3-Day Forecast
Leura 3-Day Forecast
Leura on the map
Leura is highlighted — select any city to see its climate.
Popular this month
Where to go in July — average daytime high across popular destinations.
Bucket list
Need travel inspiration? Check out our bucket list articles and be inspired.
 An alternative way to discover Sydney
We have made an overview of the sights in Sydney that you must see if you want to visit Sydney in an alternative way.
The most relaxed and alternative area of Australia is called the Byron Shire
The Byron Shire is one of the most pretty areas in the world. Not only in terms on natural beauty, also the relaxed vibe and people make this an area that remains close to your heart.
Sail the Whitsunday islands
The best travel period to sail the Whitsunday islands is “winter” between June and October, with pleasant temperatures around 23 degrees Celsius (74 Fahrenheit).
The best dive spots in Australia
Explore Australia's best dive spots: from the Great Barrier Reef to HMAS Perth. Discover vibrant corals, marine life, and historic wrecks.