La Cabrera Weather & Climate: Best Time to Visit
Average temperatures, rainfall, sunshine and the best time to visit La Cabrera.
Climate overview of La Cabrera
La Cabrera, Community of Madrid, Spain, experiences significant temperature variation throughout the year. Summers bring daytime highs of 31°C (88°F) in July, while winters cool to 9°C (48°F) in January.
Annual rain/snowfall is moderate at around 608 mm (24 in), with October being the wettest month. The city also has a distinct dry season from June to September. The sunniest month is July, with 11.7 hours of sunshine per day on average.
La Cabrera Weather by Month
Pick a month to see the average temperature, rainfall and sunshine in La Cabrera — and find the best time to visit.
Monthly Temperature in La Cabrera
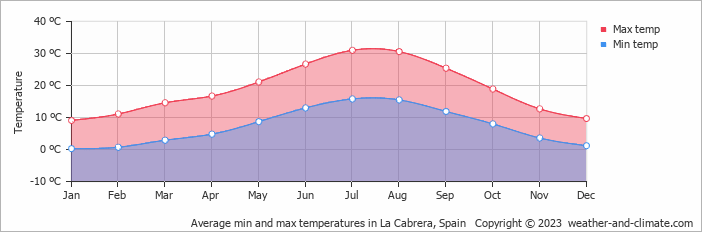
Depending on the time of the year, temperatures range from very warm to chilly in La Cabrera. Average daytime temperatures reach a very warm 31°C (88°F) in July. In January, the coolest month of the year, temperatures drop to a chilly 9°C (48°F).
At night, temperatures range from around 16°C (61°F) in July to 0°C (32°F) in January.
Check out our detailed temperature page for more information.
Temperature ranges by month
Rainfall in La Cabrera
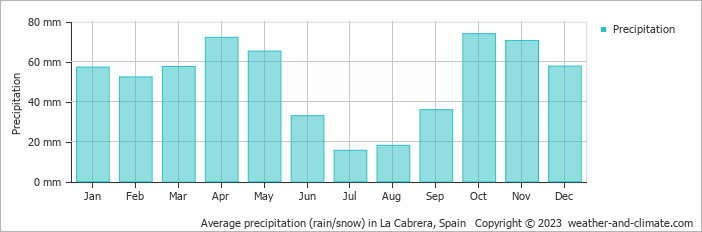
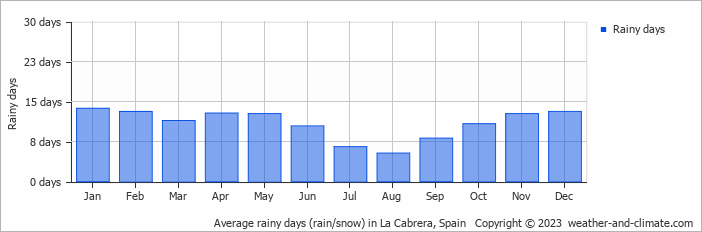
Generally, La Cabrera has a moderate amount of precipitation, averaging 608 mm (24 in) of rain/snowfall annually. La Cabrera can be quite wet during October, receiving approximately 74 mm (2.9 in) of precipitation over 11 rainy days.
In contrast, during the driest month (July), you will experience much drier conditions, with 16 mm (0.6 in) of precipitation spread across 7 rainy days days. For more details, please visit our La Cabrera Precipitation page.
The mean monthly precipitation over the year, including rain, hail, and snow
The average number of days each month with precipitation
Sunshine Hours in La Cabrera
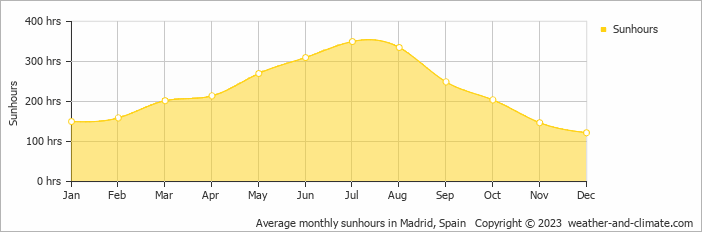
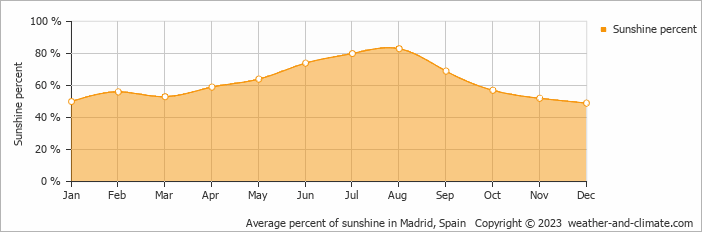
La Cabrera can be enjoyed more throughout the sunniest month of July under a blue sky, with approximately 11.7 hours of sunshine daily. In contrast, the city experiences much darker days in December, with only 4.1 hours of sunlight per day.
Visit our detailed sunshine hours page for more information.
Monthly hours of sunshine
Daily hours of sunshine
Daily percentage of sunshine
Humidity in La Cabrera by Month
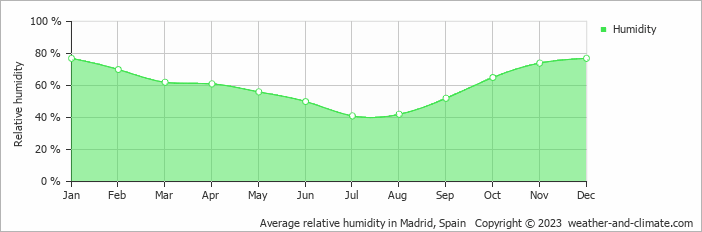
The relative humidity is high throughout the year in La Cabrera.
The city experiences its highest humidity in January, reaching 77%. In July, the humidity drops to its lowest level at 41%. What does this mean? Read our detailed page on humidity levels for further details.
Relative humidity over the year
Best Time to Visit La Cabrera
Rainfall during this time ranges from 33 mm (1.3 in) in June to 74 mm (2.9 in) in October. This means you can expect a mix of sunny days and occasional showers. Planning your next adventure but unsure where to go? Our climate tool suggests perfect locations tailored to your preferred weather conditions. Discover your ideal travel destination with our weather planner.
Frequently asked questions about the climate in La Cabrera
What is the best time to visit La Cabrera?
May, June and September typically offer the most optimal weather in La Cabrera. In contrast, January and December tend to have less optimal conditions. La Cabrera has a distinct dry season from June to September.
What temperatures can I expect in La Cabrera?
Daytime highs range from 9°C (48°F) in January to 31°C (88°F) in July. Nighttime lows range from 0°C (32°F) to 16°C (61°F). Temperatures vary considerably through the year.
How much rain does La Cabrera get?
Annual rainfall is around 608 mm (24 in). October is the wettest month with 74 mm (2.9 in), while July is the driest with 16 mm (0.6 in).
How sunny is La Cabrera?
La Cabrera receives around 2,712 hours of sunshine per year. July is the sunniest month with 350 hours, while December is the cloudiest with just 122 hours. Overall, La Cabrera enjoys abundant sunshine.
La Cabrera 3-Day Forecast
La Cabrera 3-Day Forecast
La Cabrera on the map
La Cabrera is highlighted — select any city to see its climate.
Popular this month
Where to go in July — average daytime high across popular destinations.
Bucket list
Need travel inspiration? Check out our bucket list articles and be inspired.
 El Hierro: The smallest Canary island without mass tourism
Mainly nature lovers and those seeking tranquility go to El Hierro. The island is know for its beautiful mountains and you can wonder around for days here.
Visit national Park El Teide
This national park is truly a unique place that you should not miss. You will find landscapes that seem to come from another plane and you will feel tiny in these impressive surroundings.
Sevilla: A Blend of Tradition, Culture, and Hidden Gems
Experience Sevilla in spring with Semana Santa processions and Feria de Abril festivities, set against the city's iconic landmarks and vibrant culture.
Enjoy an active trip in the mountains of Sierras de Cazorla
The mountains of Sierras de Cazorla offer spectacular views and sights and an abundance of activities that you can engage in, most of which are eco-friendly!