Koppl Weather & Climate: Best Time to Visit
Average temperatures, rainfall, sunshine and the best time to visit Koppl.
Climate overview of Koppl
The climate in Koppl, Salzburg, Austria, is marked by large temperature swings across the seasons, ranging from 23°C (73°F) in July to 2°C (36°F) in January.
The city has a wet climate, receiving around 1790 mm (70 in) of rain/snowfall per year. Despite the high annual total, it has a distinct rainy season from May to August. June is the wettest month. Sunshine peaks in July, when the city sees around 7.4 hours of sunshine per day.
Koppl Weather by Month
Pick a month to see the average temperature, rainfall and sunshine in Koppl — and find the best time to visit.
Monthly Temperature in Koppl
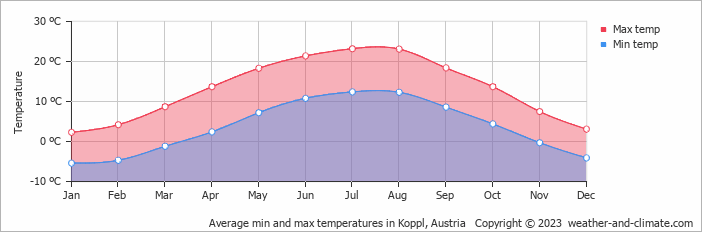
In Koppl, temperatures differ significantly between summer and winter months. On average, daytime temperatures range from a comfortable 23°C (73°F) in July to a chilly 2°C (36°F) in January.
Nighttime temperatures range from 12°C (54°F) in July to -5°C (23°F) in January.
Check out our detailed temperature page for more information.
Temperature ranges by month
Rainfall in Koppl
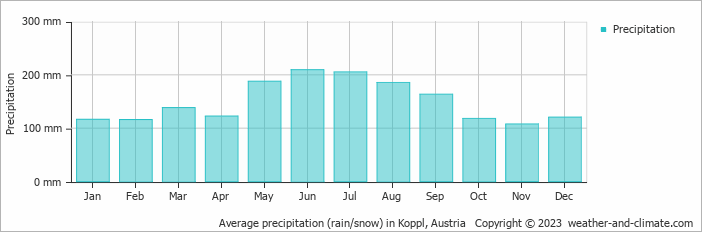
Koppl experiences significant rain/snowfall throughout the year, averaging 1790 mm (70 in) of precipitation annually. The amount of precipitation varies moderately throughout the year. The wettest month, June, sees around 209 mm (8.2 in) of rainfall, perfect for those who enjoy a bit of rain now and then. The driest month, November, still receives a respectable 108 mm (4.3 in) of rainfall. For more details, please visit our Koppl Precipitation page.
The mean monthly precipitation over the year, including rain, hail, and snow
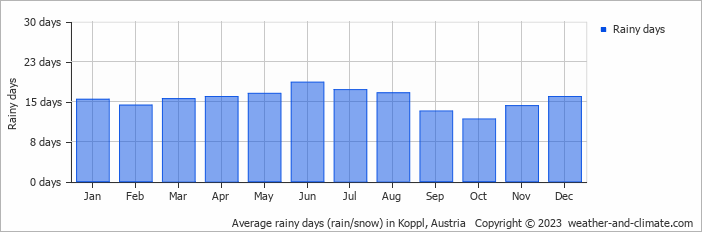
The average number of days each month with precipitation
Sunshine Hours in Koppl
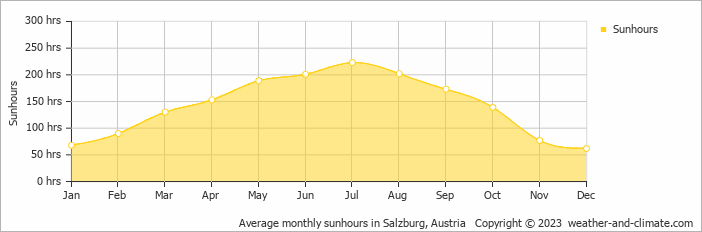
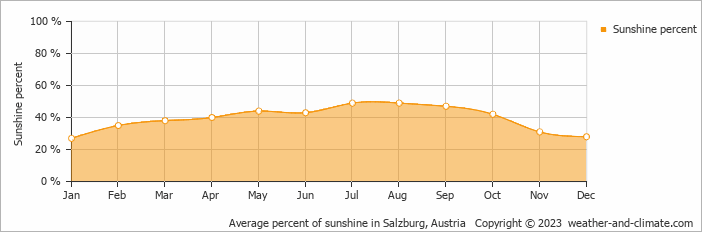
In Koppl, summer days are longer and more sunny, with daily sunshine hours peaking at 7.4 hours in July. As the darker season arrives, the brightness of the sun becomes less. December sees a soft sun for only 2.1 hours per average day.
Visit our detailed sunshine hours page for more information.
Monthly hours of sunshine
Daily hours of sunshine
Daily percentage of sunshine
Humidity in Koppl by Month
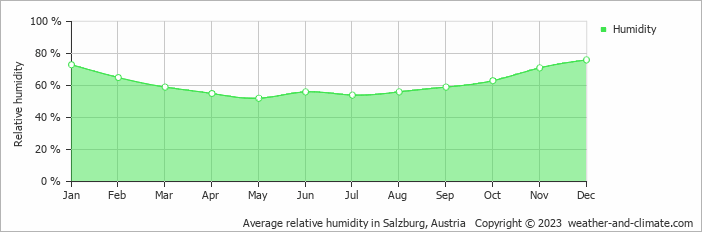
The relative humidity is high throughout the year in Koppl.
The city experiences its highest humidity in December, reaching 76%. In May, the humidity drops to its lowest level at 52%. What does this mean? Read our detailed page on humidity levels for further details.
Relative humidity over the year
Wind Speed in Koppl
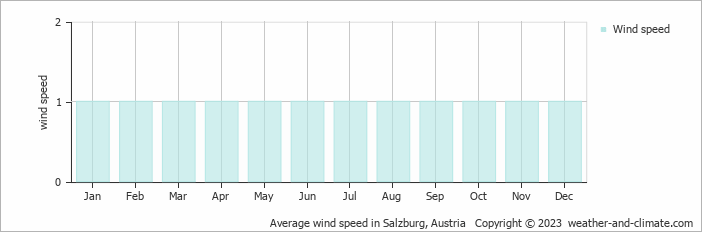
The average wind speed over the year ranges from 1 m/s (2 knots) to 1 m/s (2 knots). It is lower in January, February, March, April, May, June, July, August, September, October, November and December and higher in January, February, March, April, May, June, July, August, September, October, November and December. What does this mean?
The mean monthly wind speed over the year (meters per second)
Best Time to Visit Koppl
Be prepared for heavier rainfall during May, June, July, August and September, the wettest period of the year. Need help choosing your next travel destination? We offer a specialized tool that matches you with locations based on your weather preferences. Explore destinations that suit your climate preferences.
Frequently asked questions about the climate in Koppl
What is the best time to visit Koppl?
August and September typically offer the most optimal weather in Koppl. In contrast, January, February, March, November and December tend to have less optimal conditions. Koppl has a distinct rainy season from May to August.
What temperatures can I expect in Koppl?
Daytime highs range from 2°C (36°F) in January to 23°C (73°F) in July. Nighttime lows range from -5°C (23°F) to 12°C (54°F). Temperatures vary considerably through the year.
How much rain does Koppl get?
Annual rainfall is around 1790 mm (70 in). June is the wettest month with 209 mm (8.2 in), while November is the driest with 108 mm (4.3 in).
How sunny is Koppl?
Koppl receives around 1,707 hours of sunshine per year. July is the sunniest month with 223 hours, while December is the cloudiest with just 62 hours.
Koppl 3-Day Forecast
Koppl 3-Day Forecast
Koppl on the map
Koppl is highlighted — select any city to see its climate.
Popular this month
Where to go in July — average daytime high across popular destinations.
Bucket list
Need travel inspiration? Check out our bucket list articles and be inspired.
 Ski Arlberg is the snow mecca of the Alps
Ski Arlberg is one of the most extensive and snow-sure ski resorts in Austria. In this area you will find challenging slopes, bustling après-ski and a combination of sporty and traditional villages.
Snowbombing Festival in Austria
Snowbombing Festival in Austria. Imagine that you can combine your favorite festival with all the benefits of a winter sports holiday.
Cycle the Danube trail
The Danube cycle route is one of the most popular cycling routes in Europe, and rightly so, because it is a varied route that is interesting both in terms of culture and nature.