Kolobrzeg Weather and Climate: A Comprehensive Guide
The climate in Kołobrzeg lies between a humid continental and oceanic climate. This is characterized by warm summers. The temperature in winter can often drop below freezing. Especially if the wind comes from the east. The cold wind from Russia can make the temperature drop with big numbers within a few hours.
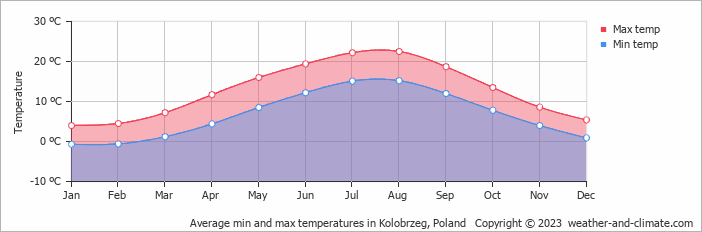
Average maximum day and minimum night temperature
Visitors to Kolobrzeg can expect significant temperature changes throughout the year. Average maximum daytime temperatures range from a comfortable 23°C in August, the warmest time of the year, to a chilly 4°C during cooler months like January.
At night, temperatures typically drop to an average of around -1°C during these months.Check out our detailed temperature page for more information.
Temperature ranges by month
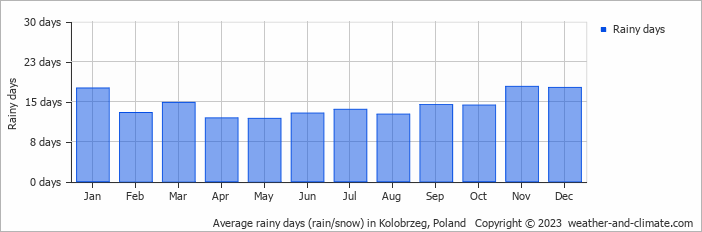
Precipitation and rainy days
Generally, Kolobrzeg experiences moderate precipitation patterns, averaging 819 mm yearly. While rainfall varies throughout the year, each season offers its own charm. July brings wetter days averaging 86 mm of precipitation, spread over 14 rainy days.
In contrast, April experiences a drier climate, with about 42 mm of rainfall spread across 12 rainy days.The mean monthly precipitation over the year, including rain, hail and snow

The average number of days each month with precipitation
Sunshine over the year
Seasonal changes in sunshine hours are quite dramatic in Kolobrzeg. While May receives considerable daily sunshine with up to 8.6 hours, December marks the darkest time of the year, where sunshine is scarce with only 1 hour of sunlight per day.
Visit our detailed sunshine hours page for more information.
Monthly hours of sunshine
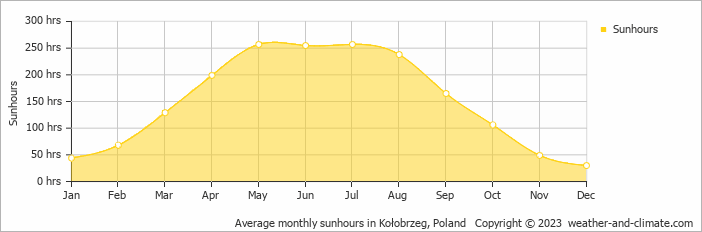
Daily hours of sunshine
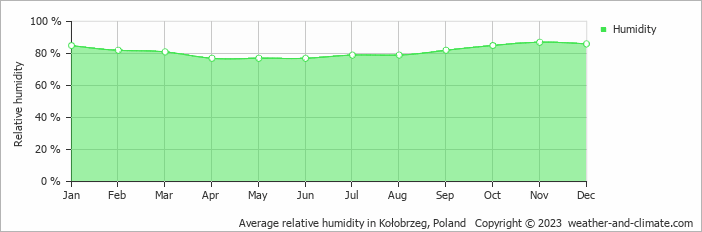
Average humidity
The city experiences its highest humidity in November, reaching 87%. In April, the humidity drops to its lowest level at 77%. What does this mean? Read our detailed page on humidity levels for further details.
Relative humidity over the year
Forecast for Kolobrzeg


Select a Month of Interest
Check the conditions for any month of the year.
The best time of year to visit Kolobrzeg in Poland
During the months of July and August you are most likely to experience good weather with pleasant average temperatures that fall between 20°C and 26°C.Other facts from our historical weather data:
August has an average maximum temperature of 23°C and is the warmest month of the year.
The coldest month is January with an average maximum temperature of 4°C.
July tops the wettest month list with 86 mm of rainfall.
April is the driest month with 42 mm of precipitation.
July is the sunniest month with an average of 257 hours of sunshine.
No idea where to travel to this year? We have a tool that recommends destinations based on your ideal conditions. Find out where to go with our weather planner.


