Kinnula Weather & Climate: Best Time to Visit
Average temperatures, rainfall, sunshine and the best time to visit Kinnula.
Climate overview of Kinnula
The climate in Kinnula, Finland, is marked by large temperature swings across the seasons, ranging from 22°C (72°F) in July to -4°C (25°F) in February.
The city receives around 718 mm (28 in) of rain/snowfall per year. It experiences a distinct dry season from February to March. July is the wettest month and March the driest.
Kinnula Weather by Month
Pick a month to see the average temperature, rainfall and sunshine in Kinnula — and find the best time to visit.
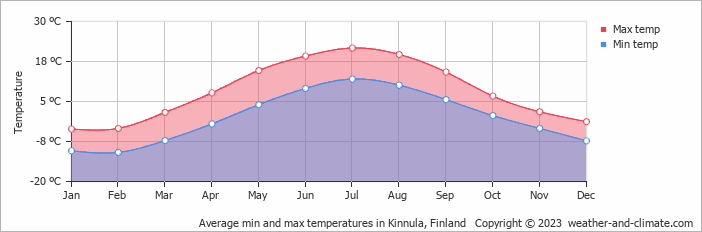
Monthly Temperature in Kinnula
In Kinnula, temperatures differ significantly between summer and winter months. On average, daytime temperatures range from a pleasant 22°C (72°F) in July to a very cold -4°C (25°F) in February.
Nighttime temperatures range from 12°C (54°F) in July to -11°C (12°F) in February.
Check out our detailed temperature page for more information.
Temperature ranges by month
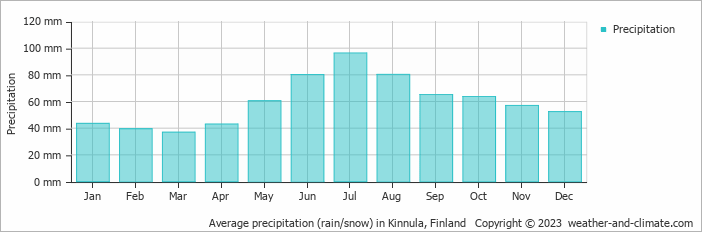
Rainfall in Kinnula
On average, Kinnula receives a reasonable amount of rain/snowfall, with an annual precipitation of 718 mm (28 in). The seasons in Kinnula bring significant changes in precipitation. The wettest month, July, receives moderate rainfall, with an average of 96 mm (3.8 in) of precipitation. This rainfall is distributed across 15 rainy days.
In contrast, the driest month, March, experiences much less snowfall, totaling 37 mm (1.5 in) over 14 snowy days. These distinct seasonal differences provide diverse experiences throughout the year. For more details, please visit our Kinnula Precipitation page.
The mean monthly precipitation over the year, including rain, hail, and snow
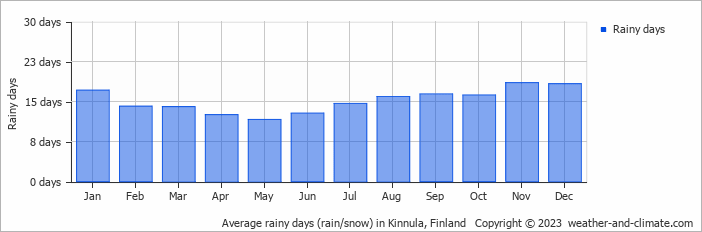
The average number of days each month with precipitation
Best Time to Visit Kinnula
Frequently asked questions about the climate in Kinnula
What is the best time to visit Kinnula?
July and August typically offer the most optimal weather in Kinnula. In contrast, January, February, March, April, October, November and December tend to have less optimal conditions. Kinnula has a distinct dry season from February to March.
What temperatures can I expect in Kinnula?
Daytime highs range from -4°C (25°F) in February to 22°C (72°F) in July. Nighttime lows range from -11°C (12°F) to 12°C (54°F). Temperatures vary considerably through the year.
How much rain does Kinnula get?
Annual rainfall is around 718 mm (28 in). July is the wettest month with 96 mm (3.8 in), while March is the driest with 37 mm (1.5 in).
Kinnula 3-Day Forecast
Kinnula 3-Day Forecast
Kinnula on the map
Kinnula is highlighted — select any city to see its climate.
Popular this month
Where to go in July — average daytime high across popular destinations.
Bucket list
Need travel inspiration? Check out our bucket list articles and be inspired.
 Air Guitar World Championship Finland
This is something you might want to add to your bucket list. August is also the perfect time to visit Finland. The days are long and the temperature is amazing.
Sleeping in a glass iglo in Finland
Sleeping in a glass igloo with the Northern Lights shining above you. The most famous place is in the Iglo village in Kakslattaunen. The idea is amazing and definitely something to add to your bucket list.
 See the northern lights
The northern lights, polar light or Aarora Borealis is a true spectacle of nature! Green, sometimes purple, red and yellow streaks of light colors the dark skies.