Irdning Weather and Climate: A Comprehensive Guide
The climate in Irdning is marked by big temperature swings throughout the year.
Temperatures range from pleasant during the warmest months
to very cold in the cooler months.
It also has a relatively rain/snowy climate with high levels of precipitation.
Let’s explore the climate details in depth to provide you with a complete overview.
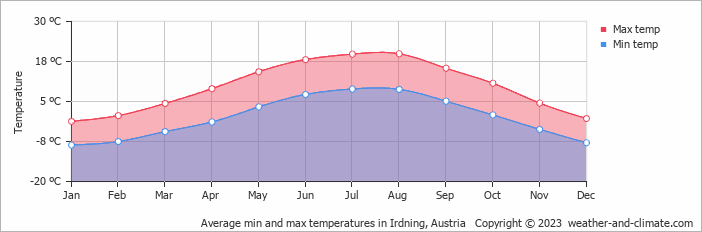
Average maximum day and minimum night temperature
In Irdning, temperatures differ significantly between summer and winter months. On average, daytime temperatures range from a pleasant 20°C in August to a very cold -1°C in January.
Nighttime temperatures can drop, with average lows reaching -9°C in January.Check out our detailed temperature page for more information.
Temperature ranges by month
Precipitation and rainy days
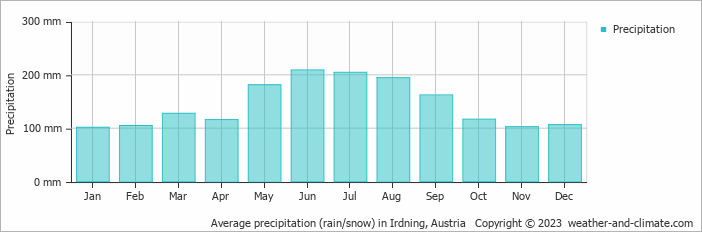
Irdning experiences significant rain/snowfall throughout the year, averaging 1726 mm of precipitation annually. The amount of precipitation varies moderately throughout the year. The wettest month, June, sees around 209 mm of rainfall, perfect for those who enjoy a bit of rain now and then. The driest month, January, still receives a respectable 101 mm of snowfall.
The mean monthly precipitation over the year, including rain, hail and snow
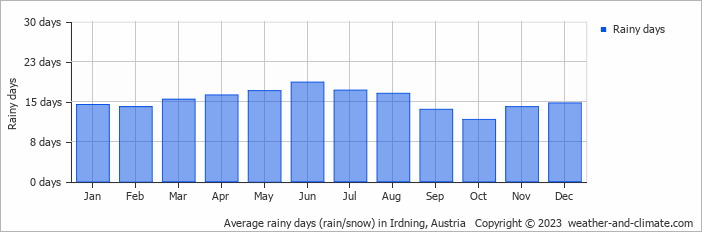
The average number of days each month with precipitation
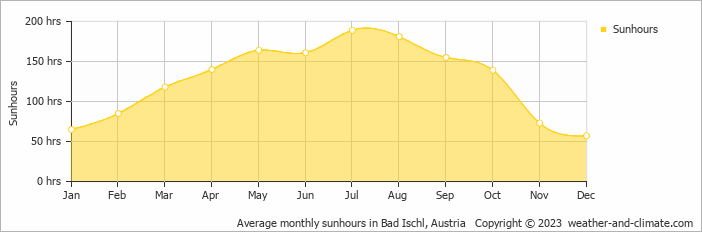
Sunshine over the year
In Irdning, summer days are longer and more sunny, with daily sunshine hours peaking at 6.3 hours in July. As the darker season arrives, the brightness of the sun becomes less. December sees a soft sun for only 1.9 hours per average day.
Visit our detailed sunshine hours page for more information.
Monthly hours of sunshine
Daily hours of sunshine
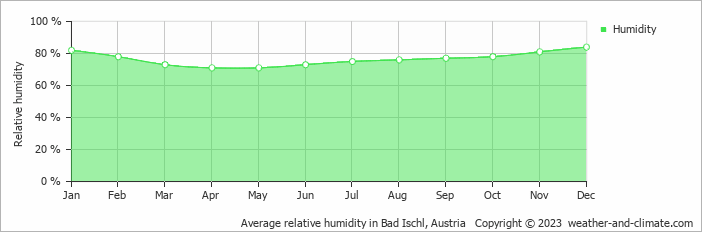
Average humidity
The relative humidity is high throughout the year in Irdning.
The city experiences its highest humidity in December, reaching 84%. In April, the humidity drops to its lowest level at 71%. What does this mean? Read our detailed page on humidity levels for further details.
Relative humidity over the year
Forecast for Irdning


Select a Month of Interest
Check the conditions for any month of the year.
The best time of year to visit Irdning in Austria
Other facts from our historical weather data:Most rainfall (rainy season) is seen in May, June, July, August and September.
The coldest season / winter is in the following months: January, February and December.
August has an average maximum temperature of 20°C and is the warmest month of the year.
The coldest month is January with an average maximum temperature of -1°C.
June tops the wettest month list with 209 mm of rainfall.
January is the driest month with 101 mm of precipitation.
July is the sunniest month with an average of 189 hours of sunshine.
No idea where to travel to this year? We have a tool that recommends destinations based on your ideal conditions. Find out where to go with our weather planner.