Inis Mor Weather & Climate: Best Time to Visit
Average temperatures, rainfall, sunshine and the best time to visit Inis Mor.
Climate overview of Inis Mor
The climate in Inis Mor, Inishmore, Ireland, sees a moderate range of temperatures across the year, from 18°C (64°F) in August down to 10°C (50°F) in February.
With around 1629 mm (64 in) of annual rainfall, Inis Mor has a notably wet climate. The wettest month is November.
Inis Mor Weather by Month
Pick a month to see the average temperature, rainfall and sunshine in Inis Mor — and find the best time to visit.
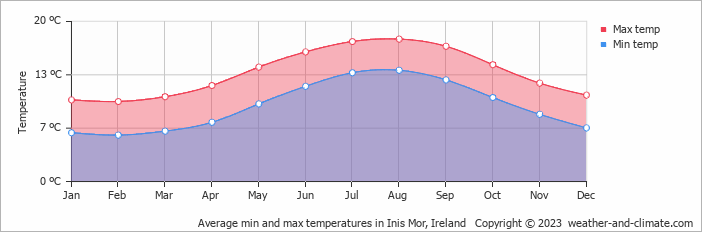
Monthly Temperature in Inis Mor
The climate in Inis Mor experiences moderate temperature changes, with mild shifts between seasons. Average daytime temperatures reach a moderate 18°C (64°F) in August. In February, the coolest month of the year, temperatures drop to a chilly 10°C (50°F).
At night, temperatures range from around 14°C (57°F) in August to 6°C (43°F) in February.
Check out our detailed temperature page for more information.
Temperature ranges by month
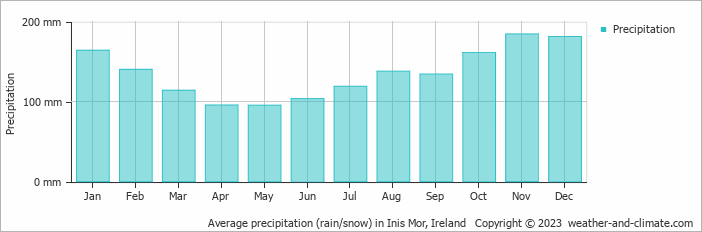
Rainfall in Inis Mor
Inis Mor experiences significant rainfall throughout the year, averaging 1629 mm (64 in) of precipitation annually. Inis Mor experiences moderate seasonal variation in rainfall, with monthly averages ranging from 184 mm (7.2 in) in November, the wettest month, and 95 mm (3.7 in) in May, the driest month. For more details, please visit our Inis Mor Precipitation page.
The mean monthly precipitation over the year, including rain, hail, and snow
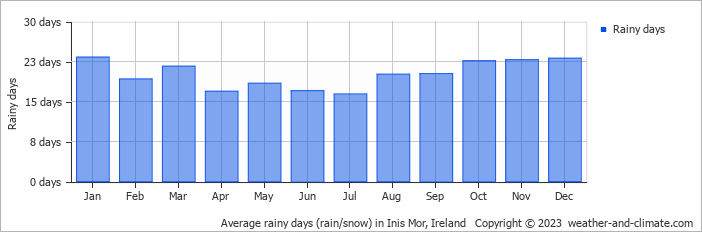
The average number of days each month with precipitation
Best Time to Visit Inis Mor
Be prepared for heavier rainfall during January, October, November and December, the wettest period of the year. Wondering where to travel based on your weather preferences? Our recommendation tool helps you find destinations with your ideal climate conditions. Use our weather planner to find your perfect destination.
Frequently asked questions about the climate in Inis Mor
What is the best time to visit Inis Mor?
May, July and August typically offer the most optimal weather in Inis Mor. In contrast, January, February, March, November and December tend to have less optimal conditions.
What temperatures can I expect in Inis Mor?
Daytime highs range from 10°C (50°F) in February to 18°C (64°F) in August. Nighttime lows range from 6°C (43°F) to 14°C (57°F).
How much rain does Inis Mor get?
Annual rainfall is around 1629 mm (64 in). November is the wettest month with 184 mm (7.2 in), while May is the driest with 95 mm (3.7 in).
Inis Mor 3-Day Forecast
Inis Mor 3-Day Forecast
Inis Mor on the map
Inis Mor is highlighted — select any city to see its climate.
Popular this month
Where to go in July — average daytime high across popular destinations.
Bucket list
Need travel inspiration? Check out our bucket list articles and be inspired.
 Go to Dingle in Ireland
Dolphins, Whales and breathtaking views. The colorful fishing village Dingle in Ireland has it all and this town is a must for your bucket list.
An Irish adventure like no other in Killarney National Park
Head down to the South West part of the country, County Kerry, to the small town of Killarney. If you want to experience what Ireland is really all about
Horseback riding in Ireland
Ireland is the most ideal place in the world for horseback riding. Combine this with the most hospitable people you will ever encounter and you have an unforgettable dream trip to add to your bucket list.