Hapuna Beach (HI) Weather & Climate: Best Time to Visit
Average temperatures, rainfall, sunshine and the best time to visit Hapuna Beach.
Climate overview of Hapuna Beach
Hapuna Beach, Hawaii, United States of America, has a stable climate with little temperature variation across the year. Average daytime temperatures hover around 26°C (79°F), peaking in August at 28°C (82°F) and dipping in January to 24°C (75°F).
Rainfall is high, totalling around 2314 mm (91 in) per year. August is the wettest month and January the driest. The city also experiences a distinct rainy season from April to October. Sunshine peaks in June, when the city sees around 9.7 hours of sunshine per day.
Hapuna Beach Weather by Month
Pick a month to see the average temperature, rainfall and sunshine in Hapuna Beach — and find the best time to visit.
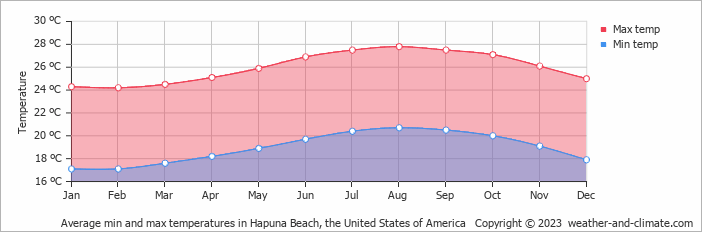
Monthly Temperature in Hapuna Beach
With minimal seasonal shifts, Hapuna Beach experiences a constant climate year-round. Average maximum daytime temperatures range from a comfortable 28°C (82°F) in August, the warmest time of the year, to a comfortable 24°C (75°F) during cooler months like January.
At night, you can expect temperatures ranging from 21°C (70°F) in August to around 17°C (63°F) during January.
Check out our detailed temperature page for more information.
Temperature ranges by month
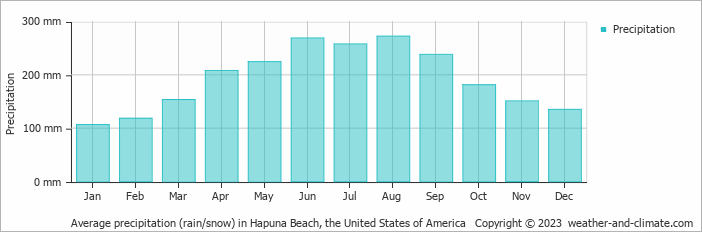
Rainfall in Hapuna Beach
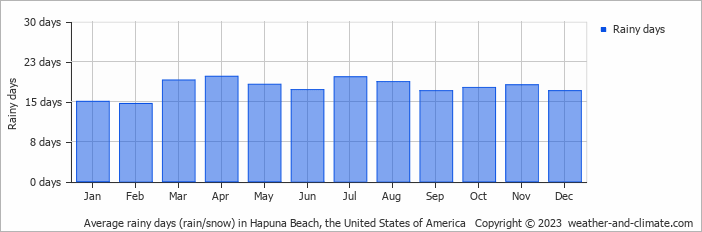
Hapuna Beach has a notably wet climate with abundant precipitation, recording 2314 mm (91 in) of rainfall per year. Significant seasonal changes in precipitation occur throughout the year. In the wettest month, August it receives heavy rainfall, averaging 272 mm (11 in) of precipitation, recorded across 19 rainy days. In contrast, the driest month January brings less rainfall, with 106 mm (4.2 in) over 15 rainy days. For more details, please visit our Hapuna Beach Precipitation page.
The mean monthly precipitation over the year, including rain, hail, and snow
The average number of days each month with precipitation
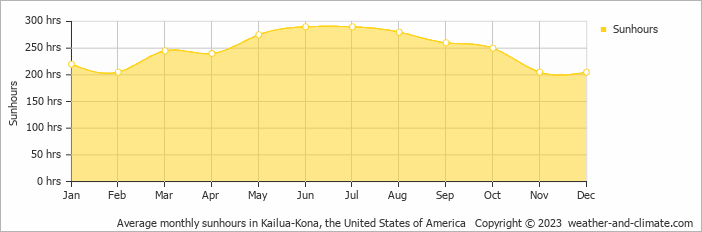
Sunshine Hours in Hapuna Beach
While the amount of sunshine in Hapuna Beach varies throughout the year, all seasons offer their own charm. Enjoy up to 9.7 hours of daily sun in June, and experience slightly darker atmosphere in February, with about 6.8 hours of daily sunlight.
Visit our detailed sunshine hours page for more information.
Monthly hours of sunshine
Daily hours of sunshine
Best Time to Visit Hapuna Beach
The wettest months are April, May, June, July, August, September and October, when precipitation is at its highest. Need help choosing your next travel destination? We offer a specialized tool that matches you with locations based on your weather preferences. Explore destinations that suit your climate preferences.
Frequently asked questions about the climate in Hapuna Beach
What is the best time to visit Hapuna Beach?
January, February, March, November and December typically offer the most optimal weather in Hapuna Beach. In contrast, June and August tend to have less optimal conditions. Hapuna Beach has a distinct rainy season from April to October.
What temperatures can I expect in Hapuna Beach?
Daytime highs range from 24°C (75°F) in January to 28°C (82°F) in August. Nighttime lows range from 17°C (63°F) to 21°C (70°F). Temperatures stay relatively stable year-round.
How much rain does Hapuna Beach get?
Annual rainfall is around 2314 mm (91 in). August is the wettest month with 272 mm (11 in), while January is the driest with 106 mm (4.2 in).
How sunny is Hapuna Beach?
Hapuna Beach receives around 2,965 hours of sunshine per year. June is the sunniest month with 290 hours, while February is the cloudiest with just 205 hours. Overall, Hapuna Beach enjoys abundant sunshine.
Hapuna Beach 3-Day Forecast
Hapuna Beach (HI) 3-Day Forecast
Hapuna Beach on the map
Hapuna Beach is highlighted — select any city to see its climate.
Popular this month
Where to go in July — average daytime high across popular destinations.
Bucket list
Need travel inspiration? Check out our bucket list articles and be inspired.
 Yosemite National Park is definitely worth a visit
Vast forests, blue lakes, towering sequoias, and majestic waterfalls hint at the beauty of Yosemite National Park—a true natural masterpiece.
The 10 most alternative cities in the United States
Discover the top 10 fun and alternative U.S. cities rich in art, culture, and adventure. From Portland's hippy charm to Sedona's stunning landscapes.
Sedona: Explore Majestic Red Rock Landscapes
A picturesque artists' town surrounded by red rocks and known for its spirituality, vortex energy, and stunning hikes like Cathedral Rock.
10 most idyllic villages to visit in the United States
Discover 10 idyllic villages in the USA, from California to Vermont. Explore their unique charm, rich history, stunning nature, and vibrant arts scenes.