Gurye Weather & Climate: Best Time to Visit
Average temperatures, rainfall, sunshine and the best time to visit Gurye.
Climate overview of Gurye
The climate in Gurye, Jirisan National Park, South Korea, is marked by large temperature swings across the seasons, ranging from 30°C (86°F) in August to 5°C (41°F) in January.
With around 1500 mm (59 in) of annual rain/snowfall, Gurye has a notably wet climate. However, this rain/snowfall is not evenly distributed — the city has distinct dry (December to January) and wet (June to August) seasons, with very warm summers and cold winters. The wettest month is July. May is the sunniest month, averaging 7.6 hours of sunshine per day.
Gurye Weather by Month
Pick a month to see the average temperature, rainfall and sunshine in Gurye - and find the best time to visit.
Monthly Temperature in Gurye
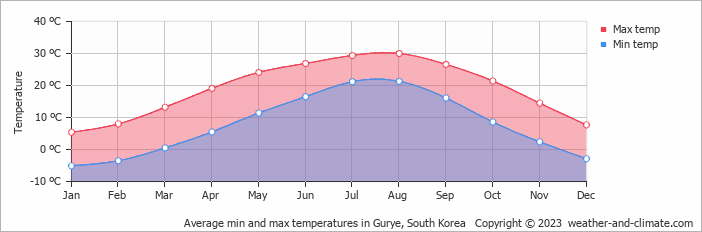
In Gurye, temperatures differ significantly between summer and winter months. Average daytime temperatures reach a very warm 30°C (86°F) in August. In January, the coolest month of the year, temperatures drop to a chilly 5°C (41°F).
At night, temperatures range from around 21°C (70°F) in August to -5°C (23°F) in January.
Check out our detailed temperature page for more information.
Temperature ranges by month
Rainfall in Gurye
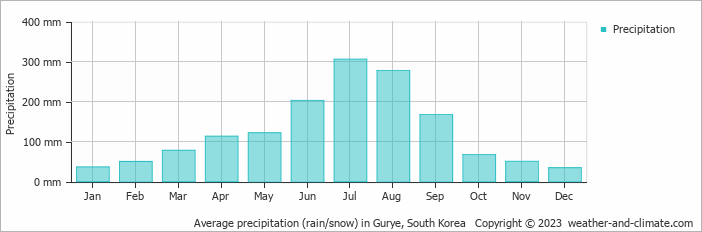
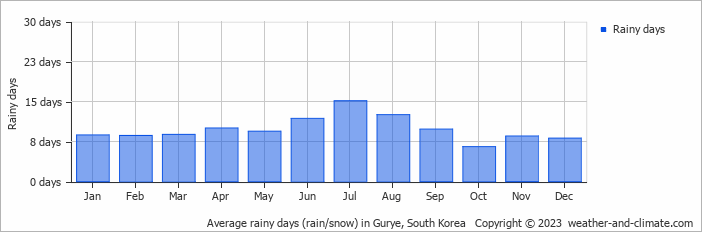
Gurye experiences significant rain/snowfall throughout the year, averaging 1500 mm (59 in) of precipitation annually. Gurye can be quite wet during July, receiving approximately 306 mm (12 in) of precipitation over 15 rainy days.
In contrast, during the driest month (December), you will experience much drier conditions, with 34 mm (1.3 in) of precipitation spread across 8 snowy/rainy days. For more details, please visit our Gurye Precipitation page.
The mean monthly precipitation over the year, including rain, hail, and snow
The average number of days each month with precipitation
Sunshine Hours in Gurye
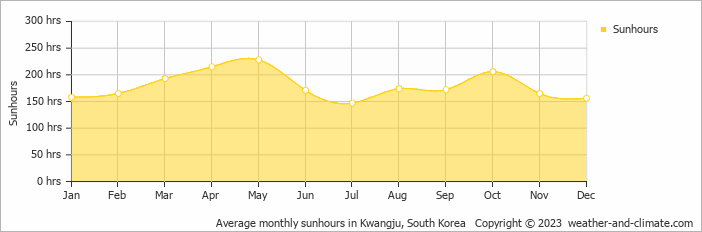
Gurye experiences moderate variation in sunshine hours across the seasons. With 7.6 hours daily sunshine in May, it dips to 4.9 hours in July, offering a balanced mix of sunny and overcast days.
Visit our detailed sunshine hours page for more information.
Monthly hours of sunshine
Daily hours of sunshine
Daily percentage of sunshine
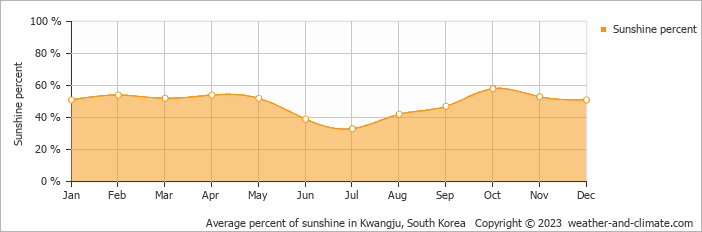
Humidity in Gurye by Month
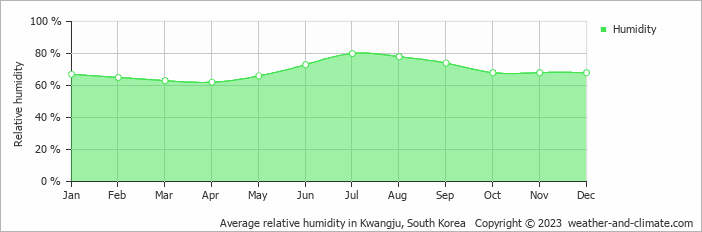
The relative humidity is high throughout the year in Gurye.
The city experiences its highest humidity in July, reaching 80%. In April, the humidity drops to its lowest level at 62%. What does this mean? Read our detailed page on humidity levels for further details.
Relative humidity over the year
Best Time to Visit Gurye
Monthly ratings reflect general weather comfort, based on daytime temperature and rainfall. Swimming and winter conditions are highlighted separately where relevant.
- Best overall: October
- Warmest weather: July and August
- Most sunshine: May
- Fewest rainy days: October, November and December
- Wettest months: June, July, August and September, when rainfall is highest.
- Seasonal pattern: Distinct dry (December to January) and wet (June to August) seasons, with very warm summers and cold winters
- Coldest conditions: January, with freezing nights around -5°C (23°F).
Frequently asked questions about the climate in Gurye
What is the best time to visit Gurye?
October typically offers the most optimal weather in Gurye. In contrast, January, February, July, August and December tend to have less optimal conditions. Gurye has distinct dry (December to January) and wet (June to August) seasons, with very warm summers and cold winters.
What temperatures can I expect in Gurye?
Daytime highs range from 5°C (41°F) in January to 30°C (86°F) in August. Nighttime lows range from -5°C (23°F) to 21°C (70°F). Temperatures vary considerably through the year.
How much rain does Gurye get?
Annual rainfall is around 1500 mm (59 in). July is the wettest month with 306 mm (12 in), while December is the driest with 34 mm (1.3 in).
How sunny is Gurye?
Gurye receives around 2,150 hours of sunshine per year. May is the sunniest month with 228 hours, while July is the cloudiest with just 147 hours. Overall, Gurye enjoys abundant sunshine.
Gurye 3-Day Forecast
Gurye 3-Day Forecast
Gurye on the map
Gurye is highlighted - select any city to see its climate.
Popular this month
Where to go in July - average daytime high across popular destinations.
Bucket list
Need travel inspiration? Check out our bucket list articles and be inspired.
