Guillot Weather & Climate: Best Time to Visit
Average temperatures, rainfall, sunshine and the best time to visit Guillot.
Climate overview of Guillot
With consistently stable weather, Guillot, Guadeloupe, sees little seasonal temperature change. Daytime highs average 28°C (82°F), ranging from 29°C (84°F) in September to 27°C (81°F) in February.
The city has a wet climate, receiving around 1359 mm (54 in) of rainfall per year. October is the wettest month. The most sunshine falls in August, with an average of 8.3 hours of daily sunshine.
Guillot Weather by Month
Pick a month to see the average temperature, rainfall and sunshine in Guillot — and find the best time to visit.
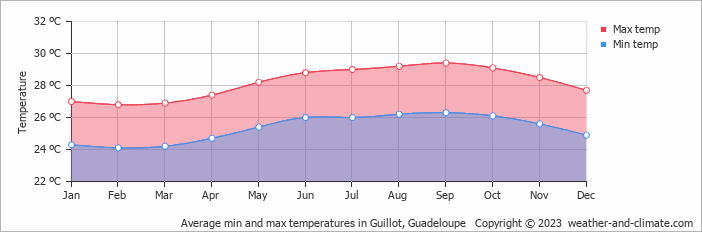
Monthly Temperature in Guillot
The climate in Guillot remains fairly constant, offering comfortable temperatures throughout the year. On average, daytime temperatures range from a comfortable 29°C (84°F) in September to a comfortable 27°C (81°F) in February.
Nighttime temperatures range from 26°C (79°F) in September to 24°C (75°F) in February.
Check out our detailed temperature page for more information.
Temperature ranges by month
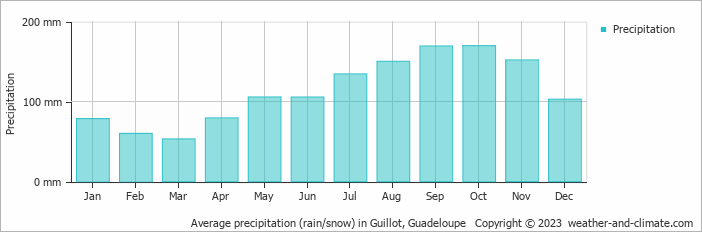
Rainfall in Guillot
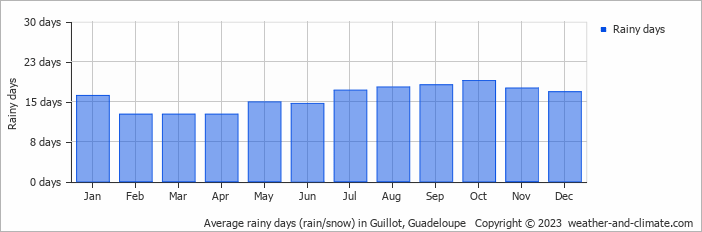
Guillot is known for its substantial rainfall, with annual precipitation reaching 1359 mm (54 in). The seasons in Guillot bring significant changes in precipitation. The wettest month, October, receives heavy rainfall, with an average of 170 mm (6.7 in) of precipitation. This rainfall is distributed across 19 rainy days.
In contrast, the driest month, March, experiences much less rainfall, totaling 53 mm (2.1 in) over 13 rainy days. These distinct seasonal differences provide diverse experiences throughout the year. For more details, please visit our Guillot Precipitation page.
The mean monthly precipitation over the year, including rain, hail, and snow
The average number of days each month with precipitation
Sunshine Hours in Guillot
The sunniest days in Guillot occur in August, with around 8.3 hours of daily sunshine. Even in November, the least sunny month, Guillot doesn't shy away from the sun, still enjoying a comfortable 6.9 hours of daily sunlight.
Visit our detailed sunshine hours page for more information.
Monthly hours of sunshine
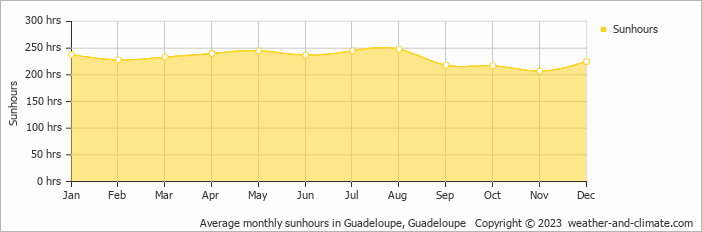
Daily hours of sunshine
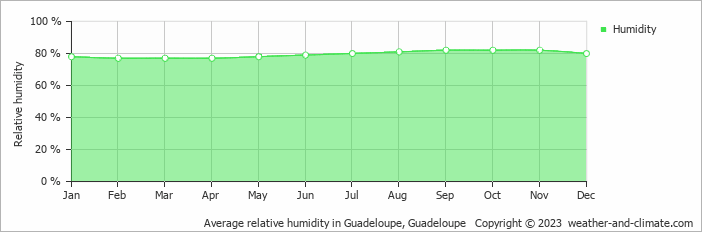
Humidity in Guillot by Month
The relative humidity is high throughout the year in Guillot.
The city experiences its highest humidity in September, reaching 82%. In February, the humidity drops to its lowest level at 77%. What does this mean? Read our detailed page on humidity levels for further details.
Relative humidity over the year
Best Time to Visit Guillot
Make your experience more enjoyable by planning to be outside during the cooler parts of the day, either early morning or as the sun begins to set. Visitors should note that September and October are part of the rainy season, bringing substantial rainfall. Looking for inspiration on where to travel this year? We have a tool that recommends destinations based on your ideal conditions. Find out where to go with our weather planner.
Frequently asked questions about the climate in Guillot
What is the best time to visit Guillot?
January, February, March and April typically offer the most optimal weather in Guillot. In contrast, May, June, July, August, September, October, November and December tend to have less optimal conditions.
What temperatures can I expect in Guillot?
Daytime highs range from 27°C (81°F) in February to 29°C (84°F) in September. Nighttime lows range from 24°C (75°F) to 26°C (79°F). Temperatures stay relatively stable year-round.
How much rain does Guillot get?
Annual rainfall is around 1359 mm (54 in). October is the wettest month with 170 mm (6.7 in), while March is the driest with 53 mm (2.1 in).
How sunny is Guillot?
Guillot receives around 2,781 hours of sunshine per year. August is the sunniest month with 248 hours, while November is the cloudiest with just 207 hours. Overall, Guillot enjoys abundant sunshine.
Guillot 3-Day Forecast
Guillot 3-Day Forecast
Guillot on the map
Guillot is highlighted — select any city to see its climate.
Popular this month
Where to go in July — average daytime high across popular destinations.