Le Moule Weather & Climate: Best Time to Visit
Average temperatures, rainfall, sunshine and the best time to visit Le Moule.
Climate overview of Le Moule
The climate in Le Moule, Grande-Terre, Guadeloupe, is remarkably consistent, with temperatures year-round averaging 28°C (82°F). The warmest month is September at 29°C (84°F), and the coolest is February at 27°C (81°F).
Rainfall is high, totalling around 1278 mm (50 in) per year. October is the wettest month and March the driest. August is the sunniest month, averaging 8.3 hours of sunshine per day.
Le Moule Weather by Month
Pick a month to see the average temperature, rainfall and sunshine in Le Moule — and find the best time to visit.
Monthly Temperature in Le Moule
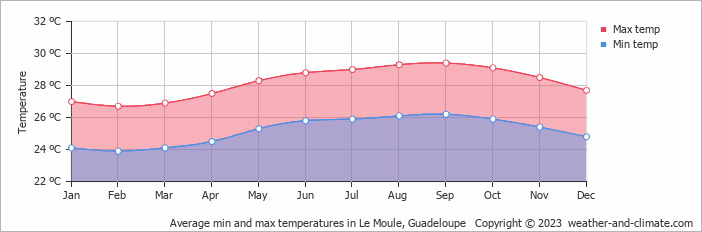
In Le Moule temperatures are generally consistent throughout the year. Average maximum daytime temperatures range from a comfortable 29°C (84°F) in September, the warmest time of the year, to a comfortable 27°C (81°F) during cooler months like February.
At night, you can expect temperatures ranging from 26°C (79°F) in September to around 24°C (75°F) during February.
Check out our detailed temperature page for more information.
Temperature ranges by month
Rainfall in Le Moule
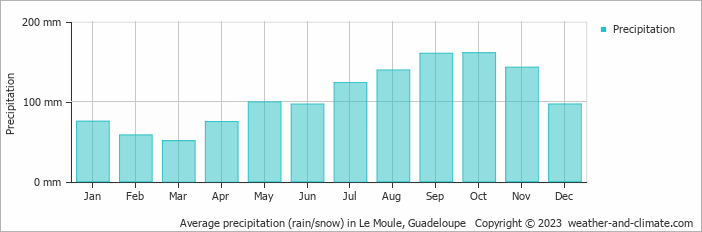
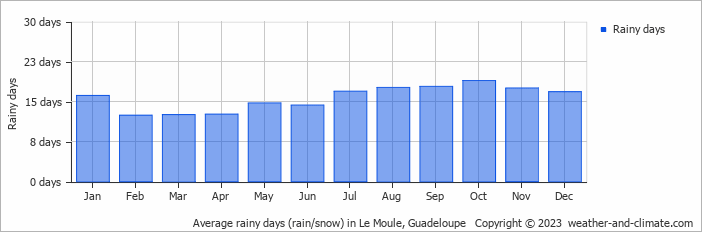
Le Moule experiences significant rainfall throughout the year, averaging 1278 mm (50 in) of precipitation annually. Significant seasonal changes in precipitation occur throughout the year. In the wettest month, October it receives heavy rainfall, averaging 161 mm (6.3 in) of precipitation, recorded across 19 rainy days. In contrast, the driest month March brings less rainfall, with 51 mm (2 in) over 13 rainy days. For more details, please visit our Le Moule Precipitation page.
The mean monthly precipitation over the year, including rain, hail, and snow
The average number of days each month with precipitation
Sunshine Hours in Le Moule
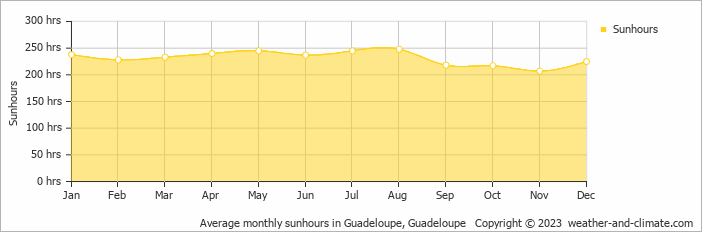
Year-round, Le Moule offers plenty of sunlight to enjoy during your holiday. The difference between the sunniest month, August, with 8.3 hours of daily sunshine, and November, the least sunny month, with 6.9 hours, is minimal.
Visit our detailed sunshine hours page for more information.
Monthly hours of sunshine
Daily hours of sunshine
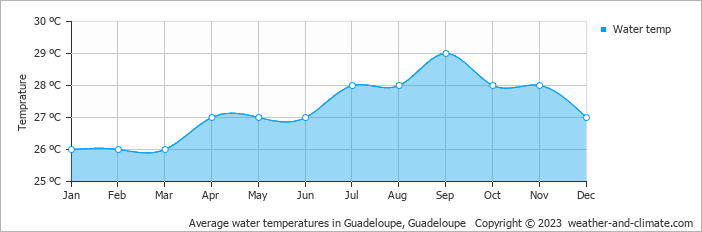
Water Temperature in Le Moule
The mean water temperature over the year ranges from 26°C (79°F) in January to 29°C (84°F) in September.
Water temperature over the year
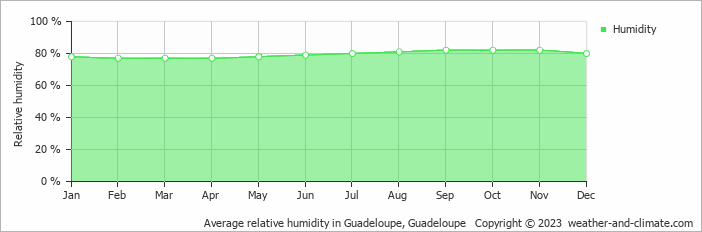
Humidity in Le Moule by Month
The relative humidity is high throughout the year in Le Moule.
The city experiences its highest humidity in September, reaching 82%. In February, the humidity drops to its lowest level at 77%. What does this mean? Read our detailed page on humidity levels for further details.
Relative humidity over the year
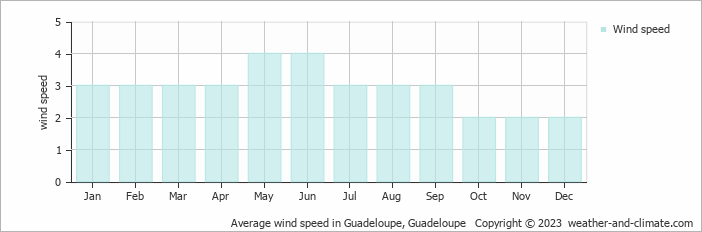
Wind Speed in Le Moule
The average wind speed over the year ranges from 2 m/s (4 knots) to 4 m/s (8 knots). It is lower in October, November and December and higher in May and June. What does this mean?
The mean monthly wind speed over the year (meters per second)
Best Time to Visit Le Moule
To make the most of your visit, consider exploring early in the morning or during the pleasant late afternoon hours when the temperature is most comfortable.
Be aware that September and October constitute the rainy season, with significant precipitation. Need help choosing your next travel destination? We offer a specialized tool that matches you with locations based on your weather preferences. Explore destinations that suit your climate preferences.
Frequently asked questions about the climate in Le Moule
What is the best time to visit Le Moule?
January, February, March, April, May, June and December typically offer the most optimal weather in Le Moule. In contrast, July, August, September, October and November tend to have less optimal conditions.
What temperatures can I expect in Le Moule?
Daytime highs range from 27°C (81°F) in February to 29°C (84°F) in September. Nighttime lows range from 24°C (75°F) to 26°C (79°F). Temperatures stay relatively stable year-round.
How much rain does Le Moule get?
Annual rainfall is around 1278 mm (50 in). October is the wettest month with 161 mm (6.3 in), while March is the driest with 51 mm (2 in).
How sunny is Le Moule?
Le Moule receives around 2,781 hours of sunshine per year. August is the sunniest month with 248 hours, while November is the cloudiest with just 207 hours. Overall, Le Moule enjoys abundant sunshine.
Le Moule 3-Day Forecast
Le Moule 3-Day Forecast
Le Moule on the map
Le Moule is highlighted — select any city to see its climate.
Popular this month
Where to go in July — average daytime high across popular destinations.