Guaillabamba Weather & Climate: Best Time to Visit
Average temperatures, rainfall, sunshine and the best time to visit Guaillabamba.
Climate overview of Guaillabamba
Guaillabamba, Ecuador, has a stable climate with little temperature variation across the year. Average daytime temperatures hover around 18°C (64°F), peaking in August at 18°C (64°F) and dipping in August to 17°C (63°F).
The city receives considerable rainfall, with around 2665 mm (105 in) annually. April is the wettest month. August is the sunniest month, averaging 8.6 hours of sunshine per day.
Guaillabamba Weather by Month
Pick a month to see the average temperature, rainfall and sunshine in Guaillabamba — and find the best time to visit.
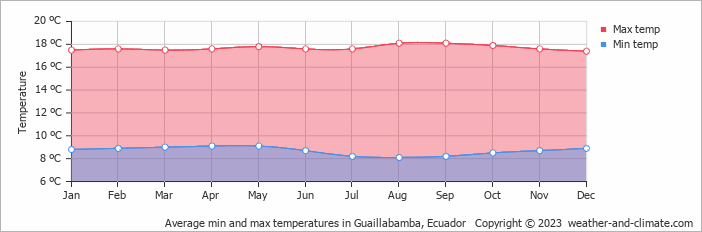
Monthly Temperature in Guaillabamba
With minimal seasonal shifts, Guaillabamba experiences a constant climate year-round. Typically, average maximum daytime temperatures range from a pleasant 18°C (64°F) in August to a moderate 17°C (63°F) in the coolest month, August.
Nights vary from 9°C (48°F) in August to around 8°C (46°F) during the colder months.
Check out our detailed temperature page for more information.
Temperature ranges by month
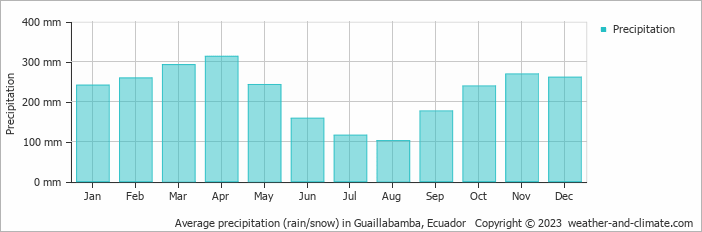
Rainfall in Guaillabamba
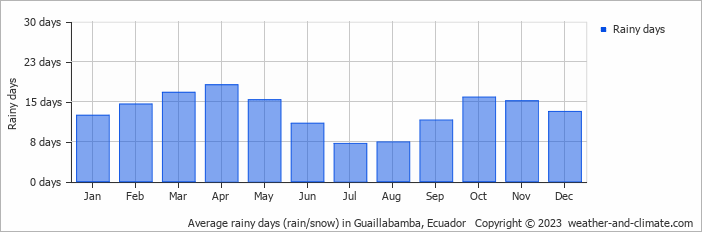
Guaillabamba has a notably wet climate with abundant precipitation, recording 2665 mm (105 in) of rainfall per year. The climate in Guaillabamba shows significant variation throughout the year. Expect heavy rainfall in April, the wettest month, with an average of 313 mm (12 in) of precipitation over 18 rainy days.
In contrast, the driest month August offers drier and sunnier days, with around 102 mm (4 in) of rainfall over 7 rainy days. For more details, please visit our Guaillabamba Precipitation page.
The mean monthly precipitation over the year, including rain, hail, and snow
The average number of days each month with precipitation
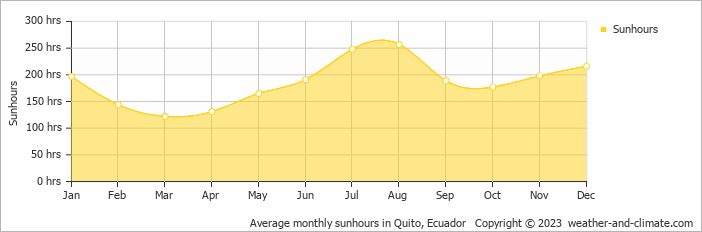
Sunshine Hours in Guaillabamba
For those who appreciate different seasons, Guaillabamba serves as an ideal destination. Expect longer, more sun-filled days in August with an average of 8.6 hours of sunshine daily, and embrace the darker days in March, offering only 4.1 hours of daily sunlight.
Visit our detailed sunshine hours page for more information.
Monthly hours of sunshine
Daily hours of sunshine
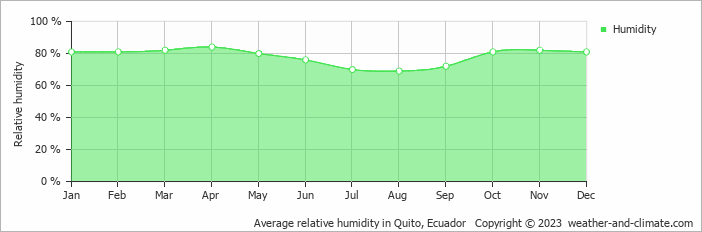
Humidity in Guaillabamba by Month
The relative humidity is high throughout the year in Guaillabamba.
The city experiences its highest humidity in April, reaching 84%. In August, the humidity drops to its lowest level at 69%. What does this mean? Read our detailed page on humidity levels for further details.
Relative humidity over the year
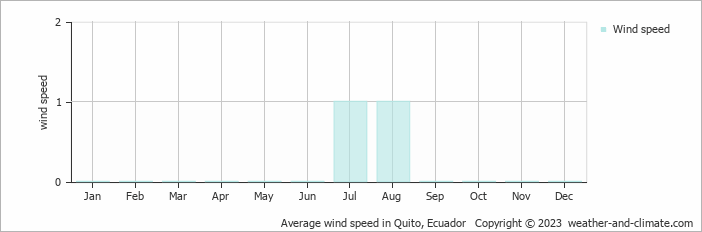
Wind Speed in Guaillabamba
The average wind speed over the year ranges from () to 1 m/s (2 knots). It is lower in January, February, March, April, May, June, September, October, November and December and higher in July and August. What does this mean?
The mean monthly wind speed over the year (meters per second)
Best Time to Visit Guaillabamba
Frequently asked questions about the climate in Guaillabamba
What is the best time to visit Guaillabamba?
June, July, August and September typically offer the most optimal weather in Guaillabamba. In contrast, January, February, March, April, May, October, November and December tend to have less optimal conditions.
What temperatures can I expect in Guaillabamba?
Daytime highs range from 17°C (63°F) in August to 18°C (64°F) in August. Nighttime lows range from 8°C (46°F) to 9°C (48°F). Temperatures stay relatively stable year-round.
How much rain does Guaillabamba get?
Annual rainfall is around 2665 mm (105 in). April is the wettest month with 313 mm (12 in), while August is the driest with 102 mm (4 in).
How sunny is Guaillabamba?
Guaillabamba receives around 2,235 hours of sunshine per year. August is the sunniest month with 257 hours, while March is the cloudiest with just 122 hours. Overall, Guaillabamba enjoys abundant sunshine.
Guaillabamba 3-Day Forecast
Guaillabamba 3-Day Forecast
Guaillabamba on the map
Guaillabamba is highlighted — select any city to see its climate.
Popular this month
Where to go in July — average daytime high across popular destinations.
Bucket list
Need travel inspiration? Check out our bucket list articles and be inspired.
 The 10 most alternative cities in South America
Discover South America's top 10 alternative cities! From Valparaíso's vibrant streets to La Paz's high-altitude charm and Medellín's innovative spirit.
 The Galapagos Islands
The Galapagos Islands is one of the most beautiful places on earth. If you want to see the origins of our planet with your own eyes, you should travel here.
A rain forest hotel in the clouds
This is not "just a lodge". It is a sanctuary of peace and nature for those who like to stay in the heart of nature with minimal environmental impact.