El Boquerón Weather and Climate: A Comprehensive Guide
El Boquerón has relatively stable weather with warm temperatures.
It also has a notably wet climate with much precipitation.
Let's now guide you through the climate details for a complete overview.
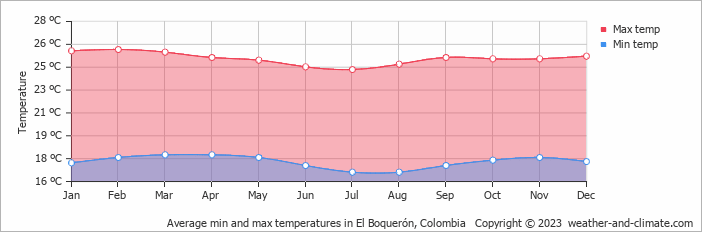
Average maximum day and minimum night temperature
The climate in El Boquerón remains fairly constant, offering comfortable temperatures throughout the year. Average maximum daytime temperatures range from a comfortable 26°C in February, the warmest time of the year, to a comfortable 24°C during cooler months like July.
At night, temperatures typically drop to an average of around 17°C during these months.Check out our detailed temperature page for more information.
Temperature ranges by month
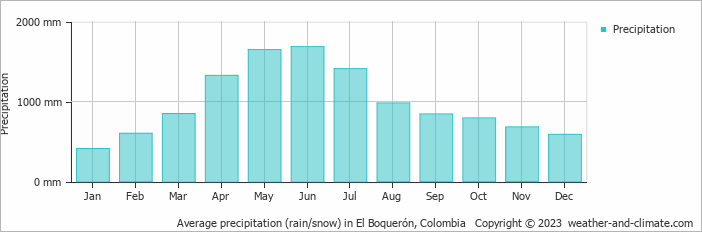
Precipitation and rainy days
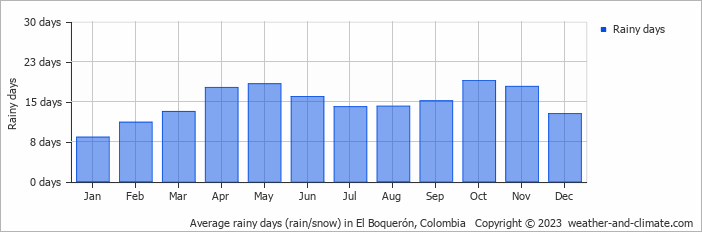
El Boquerón is known for its substantial rainfall, with annual precipitation reaching 11806 mm. Significant seasonal changes in precipitation occur throughout the year. During the wetter season, June receives heavy rainfall, averaging 1685 mm of precipitation, recorded across 16 rainy days. In contrast, the drier season, January brings less rainfall, with 410 mm over 8 rainy days. For more details, please visit our El Boquerón Precipitation page.
The mean monthly precipitation over the year, including rain, hail and snow
The average number of days each month with precipitation
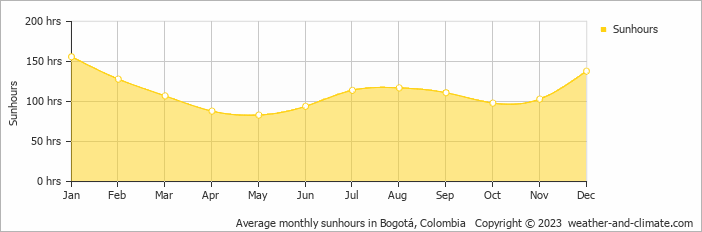
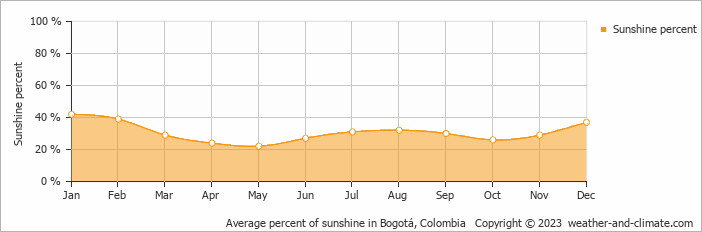
Sunshine over the year
Seasonal changes in sunshine hours are quite dramatic in El Boquerón. While January receives considerable daily sunshine with up to 5.2 hours, May marks the darkest time of the year, where sunshine is scarce with only 2.8 hours of sunlight per day.
Visit our detailed sunshine hours page for more information.
Monthly hours of sunshine
Daily hours of sunshine
Daily percentage of sunshine
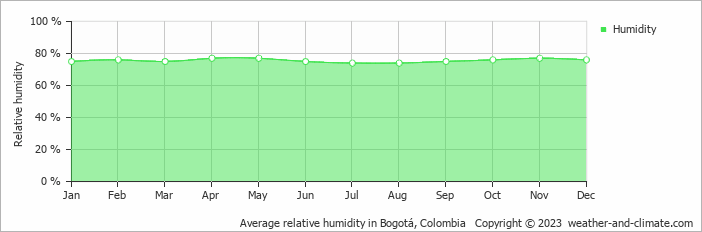
Average humidity
The relative humidity is high throughout the year in El Boquerón.
The city experiences its highest humidity in April, reaching 77%. In July, the humidity drops to its lowest level at 74%. What does this mean? Read our detailed page on humidity levels for further details.
Relative humidity over the year
Forecast for El Boquerón


Select a Month of Interest
Check the conditions for any month of the year.
The best time of year to visit El Boquerón in Colombia
Other facts from our historical weather data:February has an average maximum temperature of 26°C and is the warmest month of the year.
The coldest month is July with an average maximum temperature of 24°C.
June tops the wettest month list with 1685 mm of rainfall.
January is the driest month with 410 mm of precipitation.
January is the sunniest month with an average of 156 hours of sunshine.
No idea where to travel to this year? We have a tool that recommends destinations based on your ideal conditions. Find out where to go with our weather planner.


