Costa de Antigua, Spain - Weather and Climate
The weather in Costa de Antigua, Canary Islands, Spain is characterized by a steady average temperature throughout the year.
The city has a dry climate with very low precipitation levels.
Let’s explore the climate details to provide you with a complete overview.
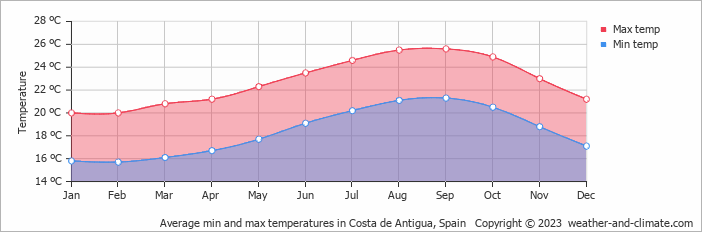
Average maximum day and minimum night temperature
In Costa de Antigua temperatures are generally consistent throughout the year. On average, daytime temperatures range from a comfortable 26°C in September to a pleasant 20°C in February.
Nighttime temperatures can drop, with average lows reaching 16°C in February.Check out our detailed temperature page for more information.
Temperature ranges by month
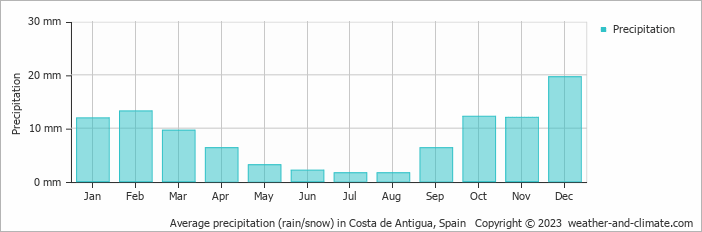
Precipitation and rainy days
Costa de Antigua sits in an arid zone with minimal moisture, averaging 100 mm of rainfall per year. The seasons in Costa de Antigua, bring significant changes in precipitation. The wettest month, December, receives low rainfall, with an average of 20 mm of precipitation. This rainfall is distributed across 3 rainy days.
In contrast, the driest month, July, experiences much less rainfall, totaling 1.6 mm over 0 rainy days. These distinct seasonal differences provide diverse experiences throughout the year. For more details, please visit our Costa de Antigua Precipitation page.The mean monthly precipitation over the year, including rain, hail and snow
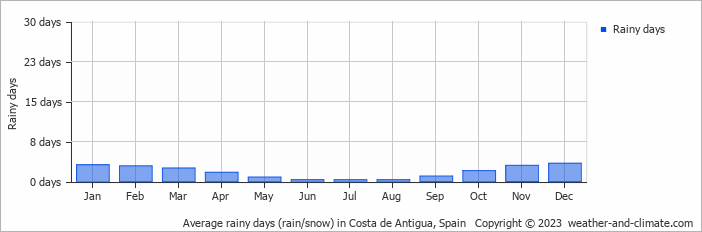
The average number of days each month with precipitation
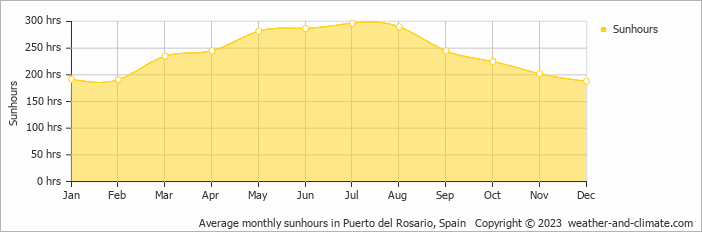
Sunshine over the year
Costa de Antigua enjoys sunny spells year-round. July sees up to 9.9 hours of daily sunshine, perfect for a sunny trip. December, the least sunny month, still offers a generous 6.3 hours of sun despite this cloudier time of the year.
Visit our detailed sunshine hours page for more information.
Monthly hours of sunshine
Daily hours of sunshine
Average humidity
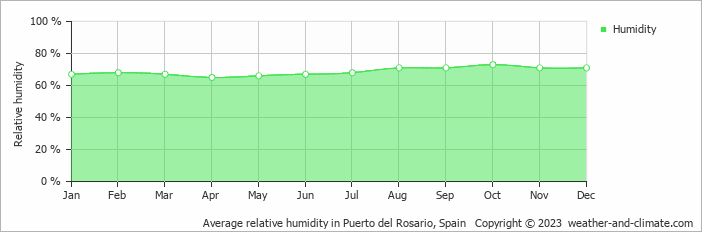
The relative humidity is high throughout the year in Costa de Antigua.
The city experiences its highest humidity in October, reaching 73%. In April, the humidity drops to its lowest level at 65%. What does this mean? Read our detailed page on humidity levels for further details.
Relative humidity over the year
Forecast for Costa de Antigua


Select a Month of Interest
Check the conditions for any month of the year.
The best time of year to visit Costa de Antigua in Spain
Other facts from our historical weather data:The hottest season / summer takes place in July, August, September and October.
September has an average maximum temperature of 26°C and is the warmest month of the year.
The coldest month is February with an average maximum temperature of 20°C.
December tops the wettest month list with 20 mm of rainfall.
August is the driest month with 2 mm of precipitation.
July is the sunniest month with an average of 297 hours of sunshine.
No idea where to travel to this year? We have a tool that recommends destinations based on your ideal conditions. Find out where to go with our weather planner.


