Coquimbito Weather & Climate: Best Time to Visit
Average temperatures, rainfall, sunshine and the best time to visit Coquimbito.
Climate overview of Coquimbito
Temperatures in Coquimbito, Mendoza Province, Argentina, vary greatly throughout the year. January is the hottest month at 32°C (90°F), while July is the coldest at 15°C (59°F).
Coquimbito sees a moderate amount of rainfall, totalling around 520 mm (20 in) per year. It experiences a distinct dry season from May to September, creating some seasonal variation. Sunshine peaks in January, when the city sees around 10.4 hours of sunshine per day.
Coquimbito Weather by Month
Pick a month to see the average temperature, rainfall and sunshine in Coquimbito — and find the best time to visit.
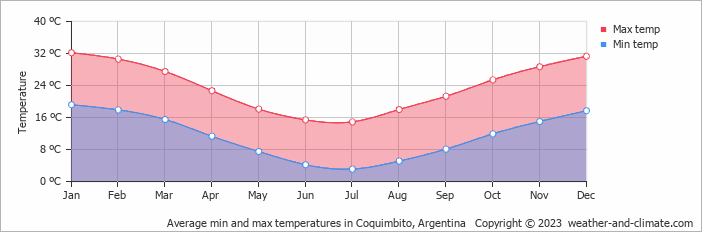
Monthly Temperature in Coquimbito
The climate in Coquimbito is known for significant temperature differences throughout the year, making the weather dynamic. Average maximum daytime temperatures range from a very warm 32°C (90°F) in January, the warmest time of the year, to a moderate 15°C (59°F) during cooler months like July.
At night, you can expect temperatures ranging from 19°C (66°F) in January to around 3°C (37°F) during July.
Check out our detailed temperature page for more information.
Temperature ranges by month
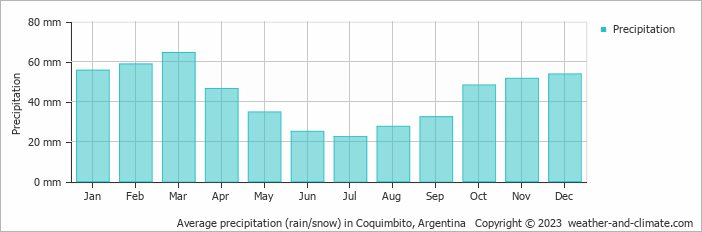
Rainfall in Coquimbito
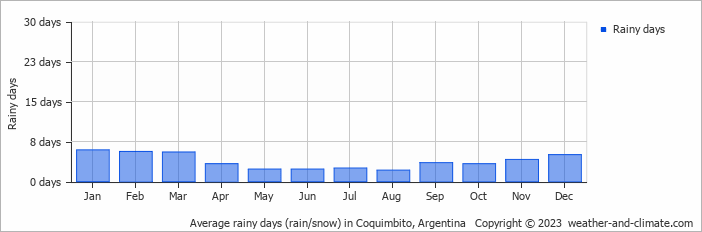
Generally, Coquimbito receives mid-range precipitation levels, with 520 mm (20 in) annually. Significant seasonal changes in precipitation occur throughout the year. In the wettest month, March it receives moderate rainfall, averaging 64 mm (2.5 in) of precipitation, recorded across 6 rainy days. In contrast, the driest month July brings less rainfall, with 22 mm (0.9 in) over 3 rainy days. For more details, please visit our Coquimbito Precipitation page.
The mean monthly precipitation over the year, including rain, hail, and snow
The average number of days each month with precipitation
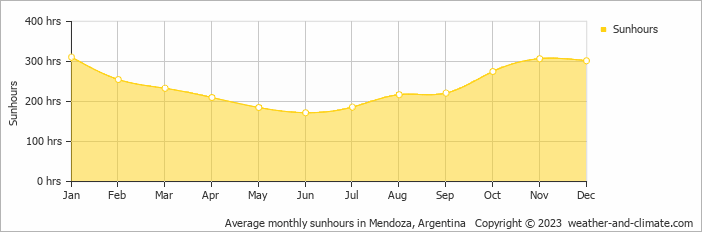
Sunshine Hours in Coquimbito
Seasonal changes in sunshine hours are quite dramatic in Coquimbito. While January receives considerable daily sunshine with up to 10.4 hours, June marks the darkest time of the year, where sunshine is scarce with only 5.7 hours of sunlight per day.
Visit our detailed sunshine hours page for more information.
Monthly hours of sunshine
Daily hours of sunshine
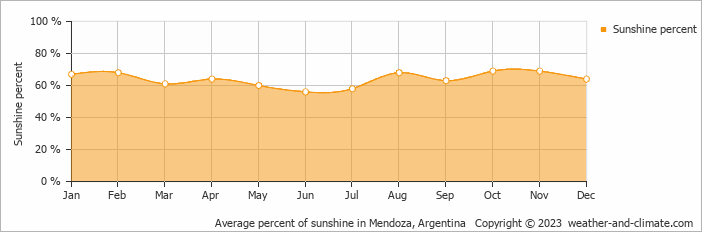
Daily percentage of sunshine
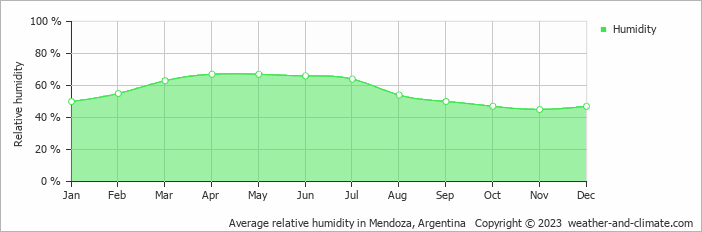
Humidity in Coquimbito by Month
The relative humidity is moderate throughout the year in Coquimbito.
The city experiences its highest humidity in April, reaching 67%. In November, the humidity drops to its lowest level at 45%. What does this mean? Read our detailed page on humidity levels for further details.
Relative humidity over the year
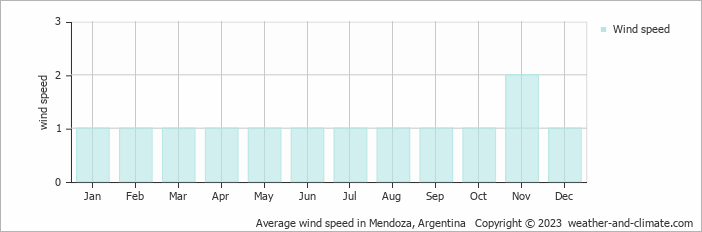
Wind Speed in Coquimbito
The mean wind speed varies between 1 m/s (2 knots) and 2 m/s (4 knots) throughout the year. It is lowest in January, February, March, April, May, June, July, August, September, October and December and highest during November. What does this mean?
The mean monthly wind speed over the year (meters per second)
Best Time to Visit Coquimbito
Frequently asked questions about the climate in Coquimbito
What is the best time to visit Coquimbito?
March, April, August, September, October and November typically offer the most optimal weather in Coquimbito. In contrast, January, February and December tend to have less optimal conditions. Coquimbito has a distinct dry season from May to September.
What temperatures can I expect in Coquimbito?
Daytime highs range from 15°C (59°F) in July to 32°C (90°F) in January. Nighttime lows range from 3°C (37°F) to 19°C (66°F). Temperatures vary considerably through the year.
How much rain does Coquimbito get?
Annual rainfall is around 520 mm (20 in). March is the wettest month with 64 mm (2.5 in), while July is the driest with 22 mm (0.9 in).
How sunny is Coquimbito?
Coquimbito receives around 2,874 hours of sunshine per year. January is the sunniest month with 311 hours, while June is the cloudiest with just 172 hours. Overall, Coquimbito enjoys abundant sunshine.
Coquimbito 3-Day Forecast
Coquimbito 3-Day Forecast
Coquimbito on the map
Coquimbito is highlighted — select any city to see its climate.
Popular this month
Where to go in July — average daytime high across popular destinations.
Bucket list
Need travel inspiration? Check out our bucket list articles and be inspired.
 The 10 most alternative cities in South America
Discover South America's top 10 alternative cities! From Valparaíso's vibrant streets to La Paz's high-altitude charm and Medellín's innovative spirit.
Be amazed by Buenos Aires
The city of beautiful museums, cute streets, green parks, lots of good food, interesting local neighborhoods and impressive historical buildings.
Explore Patagonia
A tour through Patagonia brings you to the end of the world. That’s why Patagonia is a bucket list destination for many. We recommend to visit Patagonia from November to early March.
Glacier walk on The Perito Moreno glacier
The Perito Moreno glacier and the rupture of this glacier is considered one of the most impressive natural spectacles in the world. You can wait here until a large piece of ice crumbles and plunges into the water with a lot of noise.