Chtaura Weather & Climate: Best Time to Visit
Average temperatures, rainfall, sunshine and the best time to visit Chtaura.
Climate overview of Chtaura
Chtaura, Lebanon, experiences significant temperature variation throughout the year. Summers bring daytime highs of 30°C (86°F) in August, while winters cool to 10°C (50°F) in January.
Annual rain/snowfall is moderate at around 588 mm (23 in), with February being the wettest month. The city also has a distinct dry season from May to October.
Chtaura Weather by Month
Pick a month to see the average temperature, rainfall and sunshine in Chtaura — and find the best time to visit.
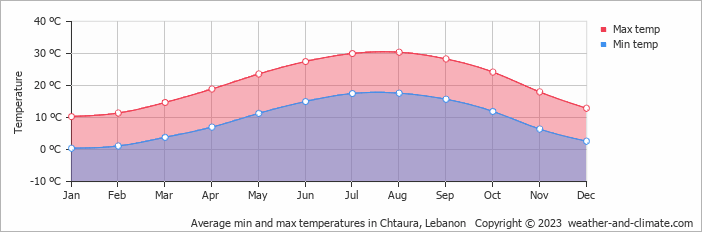
Monthly Temperature in Chtaura
Depending on the time of the year, temperatures range from very warm to chilly in Chtaura. Average daytime temperatures reach a very warm 30°C (86°F) in August. In January, the coolest month of the year, temperatures drop to a chilly 10°C (50°F).
At night, temperatures range from around 18°C (64°F) in August to 0°C (32°F) in January.
Check out our detailed temperature page for more information.
Temperature ranges by month
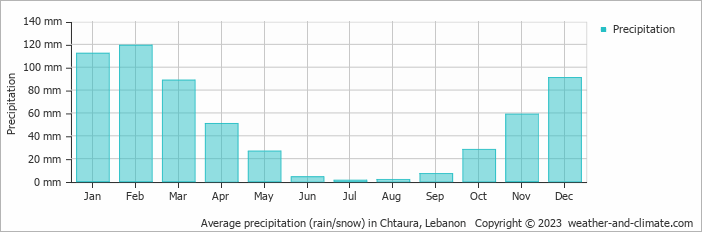
Rainfall in Chtaura
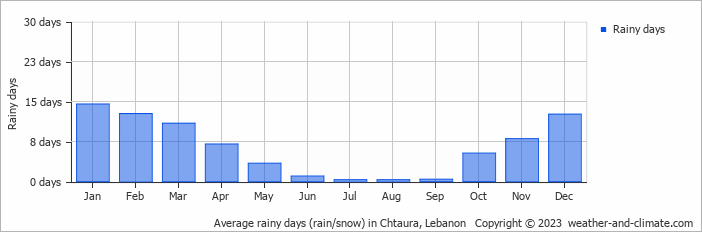
Generally, Chtaura has a moderate amount of precipitation, averaging 588 mm (23 in) of rain/snowfall annually. Chtaura can be quite wet during February, receiving approximately 119 mm (4.7 in) of precipitation over 13 rainy days.
In contrast, during the driest month (July), you will experience much drier conditions, with 1 mm (0.04 in) of precipitation spread across 0 rainy days days. For more details, please visit our Chtaura Precipitation page.
The mean monthly precipitation over the year, including rain, hail, and snow
The average number of days each month with precipitation
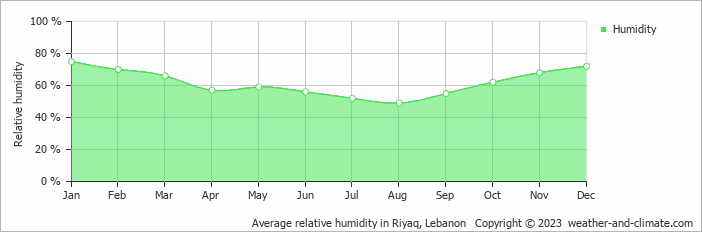
Humidity in Chtaura by Month
The relative humidity is high throughout the year in Chtaura.
The city experiences its highest humidity in January, reaching 75%. In August, the humidity drops to its lowest level at 49%. What does this mean? Read our detailed page on humidity levels for further details.
Relative humidity over the year
Best Time to Visit Chtaura
Rainfall during this time ranges from 1 mm (0.04 in) in July to 59 mm (2.3 in) in November. This means you can expect a mix of sunny days and occasional showers. Wondering where to travel based on your weather preferences? Our recommendation tool helps you find destinations with your ideal climate conditions. Use our weather planner to find your perfect destination.
Frequently asked questions about the climate in Chtaura
What is the best time to visit Chtaura?
May, June, September and October typically offer the most optimal weather in Chtaura. In contrast, January and February tend to have less optimal conditions. Chtaura has a distinct dry season from May to October.
What temperatures can I expect in Chtaura?
Daytime highs range from 10°C (50°F) in January to 30°C (86°F) in August. Nighttime lows range from 0°C (32°F) to 18°C (64°F). Temperatures vary considerably through the year.
How much rain does Chtaura get?
Annual rainfall is around 588 mm (23 in). February is the wettest month with 119 mm (4.7 in), while July is the driest with 1 mm (0.04 in).
Chtaura 3-Day Forecast
Chtaura 3-Day Forecast
Chtaura on the map
Chtaura is highlighted — select any city to see its climate.
Popular this month
Where to go in June — average daytime high across popular destinations.
Bucket list
Need travel inspiration? Check out our bucket list articles and be inspired.