Chkalovsk Weather & Climate: Best Time to Visit
Average temperatures, rainfall, sunshine and the best time to visit Chkalovsk.
Climate overview of Chkalovsk
The climate in Chkalovsk, Tajikistan, is marked by large temperature swings across the seasons, ranging from 35°C (95°F) in July to 6°C (43°F) in January.
The city has a relatively dry climate, receiving around 410 mm (16 in) of rain/snowfall per year. It does experience a distinct dry season from June to January. April is the wettest month and August the driest. Sunshine peaks in July, when the city sees around 12.7 hours of sunshine per day.
Chkalovsk Weather by Month
Pick a month to see the average temperature, rainfall and sunshine in Chkalovsk — and find the best time to visit.
Monthly Temperature in Chkalovsk
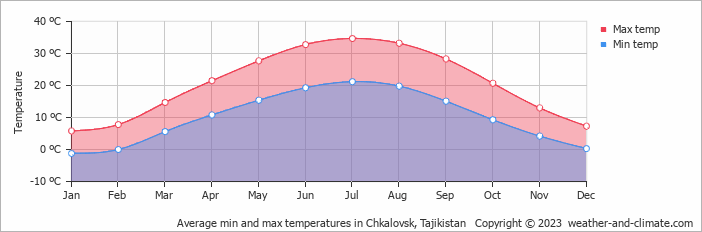
In Chkalovsk, temperatures differ significantly between summer and winter months. On average, daytime temperatures range from a very warm 35°C (95°F) in July to a chilly 6°C (43°F) in January.
Nighttime temperatures range from 21°C (70°F) in July to -1°C (30°F) in January.
Check out our detailed temperature page for more information.
Temperature ranges by month
Rainfall in Chkalovsk
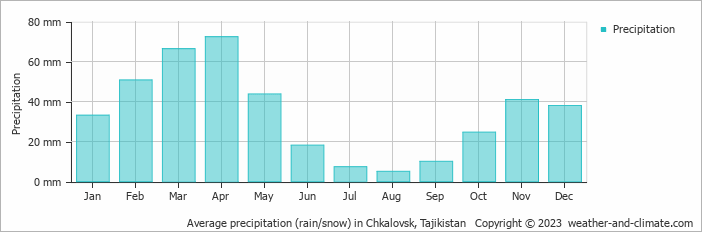
Chkalovsk typically sees modest rain/snowfall throughout the year, with an average annual precipitation of 410 mm (16 in). The seasons in Chkalovsk bring significant changes in precipitation. The wettest month, April, receives moderate rainfall, with an average of 72 mm (2.8 in) of precipitation. This rainfall is distributed across 9 rainy days.
In contrast, the driest month, August, experiences much less rainfall, totaling 5 mm (0.2 in) over a single rainy day. These distinct seasonal differences provide diverse experiences throughout the year. For more details, please visit our Chkalovsk Precipitation page.
The mean monthly precipitation over the year, including rain, hail, and snow
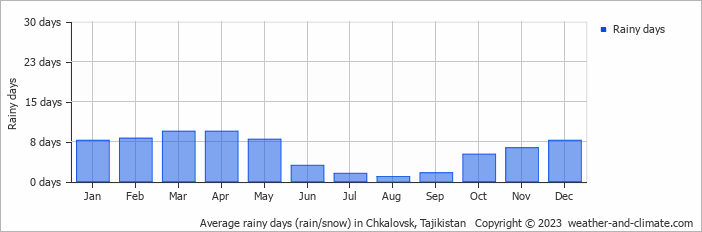
The average number of days each month with precipitation
Sunshine Hours in Chkalovsk
In Chkalovsk, summer days are longer and more sunny, with daily sunshine hours peaking at 12.7 hours in July. As the darker season arrives, the brightness of the sun becomes less. December sees a soft sun for only 3.5 hours per average day.
Visit our detailed sunshine hours page for more information.
Monthly hours of sunshine

Daily hours of sunshine
Humidity in Chkalovsk by Month
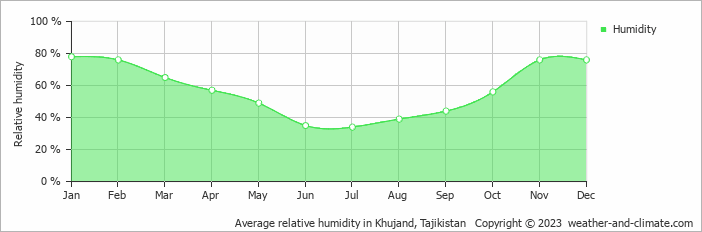
The relative humidity is moderate throughout the year in Chkalovsk.
The city experiences its highest humidity in January, reaching 78%. In July, the humidity drops to its lowest level at 34%. What does this mean? Read our detailed page on humidity levels for further details.
Relative humidity over the year
Best Time to Visit Chkalovsk
Frequently asked questions about the climate in Chkalovsk
What is the best time to visit Chkalovsk?
April, May, September and October typically offer the most optimal weather in Chkalovsk. In contrast, January, February, July and December tend to have less optimal conditions. Chkalovsk has a distinct dry season from June to January.
What temperatures can I expect in Chkalovsk?
Daytime highs range from 6°C (43°F) in January to 35°C (95°F) in July. Nighttime lows range from -1°C (30°F) to 21°C (70°F). Temperatures vary considerably through the year.
How much rain does Chkalovsk get?
Annual rainfall is around 410 mm (16 in). April is the wettest month with 72 mm (2.8 in), while August is the driest with 5 mm (0.2 in).
How sunny is Chkalovsk?
Chkalovsk receives around 2,831 hours of sunshine per year. July is the sunniest month with 382 hours, while December is the cloudiest with just 106 hours. Overall, Chkalovsk enjoys abundant sunshine.
Chkalovsk 3-Day Forecast
Chkalovsk 3-Day Forecast
Chkalovsk on the map
Chkalovsk is highlighted — select any city to see its climate.
Popular this month
Where to go in July — average daytime high across popular destinations.