Cadzand-Bad Weather & Climate: Best Time to Visit
Average temperatures, rainfall, sunshine and the best time to visit Cadzand-Bad.
Climate overview of Cadzand-Bad
Cadzand-Bad, Zeeland, Netherlands, sees big temperature differences between seasons, with August peaking at 22°C (72°F) and February dropping to 8°C (46°F).
Annual rainfall is moderate at around 869 mm (34 in), with December being the wettest month. Sunshine peaks in May, when the city sees around 7.9 hours of sunshine per day.
Cadzand-Bad Weather by Month
Pick a month to see the average temperature, rainfall and sunshine in Cadzand-Bad — and find the best time to visit.
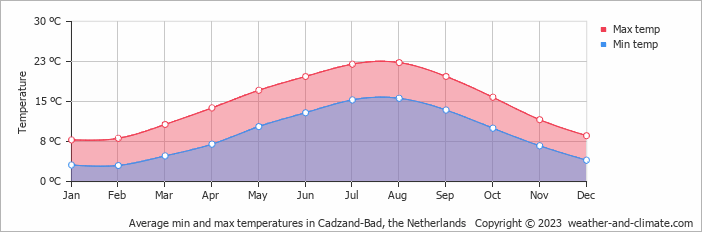
Monthly Temperature in Cadzand-Bad
Visitors to Cadzand-Bad can expect significant temperature changes throughout the year. Average daytime temperatures reach a comfortable 22°C (72°F) in August. In February, the coolest month of the year, temperatures drop to a chilly 8°C (46°F).
At night, temperatures range from around 16°C (61°F) in August to 3°C (37°F) in February.
Check out our detailed temperature page for more information.
Temperature ranges by month
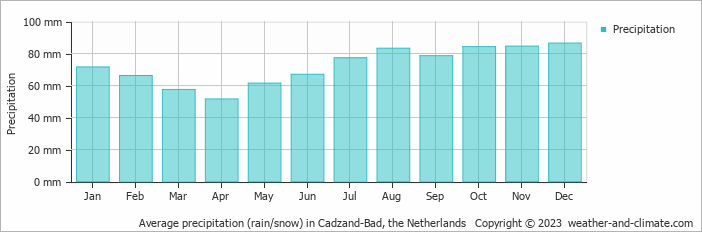
Rainfall in Cadzand-Bad
Generally, Cadzand-Bad experiences moderate precipitation patterns, averaging 869 mm (34 in) yearly. Cadzand-Bad experiences moderate seasonal variation in rainfall, with monthly averages ranging from 86 mm (3.4 in) in December, the wettest month, and 52 mm (2 in) in April, the driest month. For more details, please visit our Cadzand-Bad Precipitation page.
The mean monthly precipitation over the year, including rain, hail, and snow
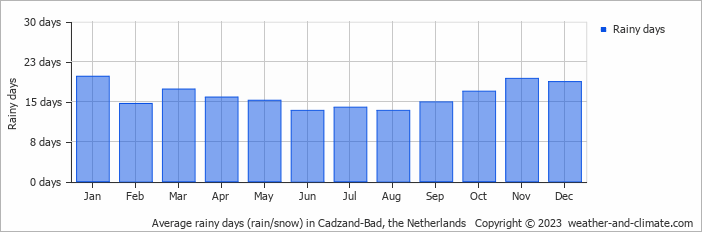
The average number of days each month with precipitation
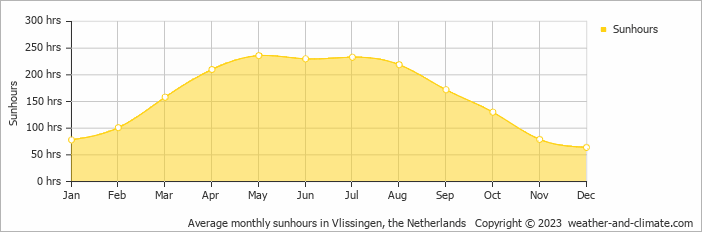
Sunshine Hours in Cadzand-Bad
Cadzand-Bad can be enjoyed more throughout the sunniest month of May under a blue sky, with approximately 7.9 hours of sunshine daily. In contrast, the city experiences much darker days in December, with only 2.1 hours of sunlight per day.
Visit our detailed sunshine hours page for more information.
Monthly hours of sunshine
Daily hours of sunshine
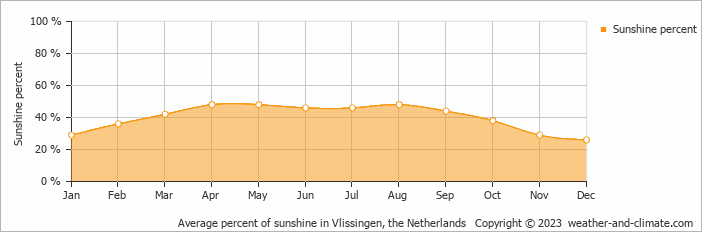
Daily percentage of sunshine
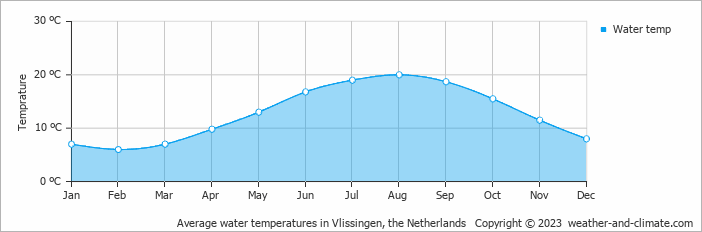
Water Temperature in Cadzand-Bad
The mean water temperature over the year ranges from 6°C (43°F) in February to 20°C (68°F) in August.
Water temperature over the year
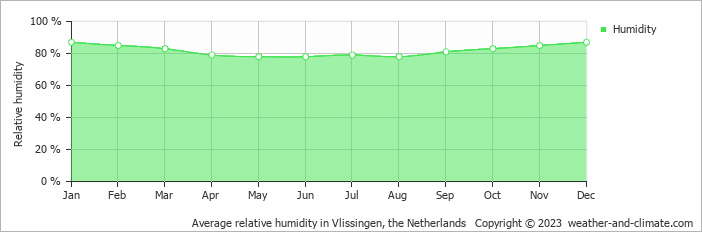
Humidity in Cadzand-Bad by Month
The city experiences its highest humidity in January, reaching 87%. In May, the humidity drops to its lowest level at 78%. What does this mean? Read our detailed page on humidity levels for further details.
Relative humidity over the year
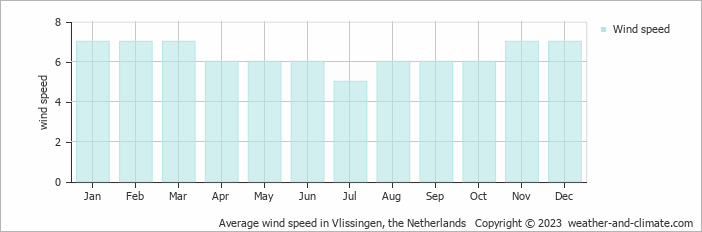
Wind Speed in Cadzand-Bad
The mean wind speed varies between 5 m/s (10 knots) and 7 m/s (14 knots) throughout the year. It is lowest in July and highest during January, February, March, November and December. What does this mean?
The mean monthly wind speed over the year (meters per second)
Best Time to Visit Cadzand-Bad
The weather does bring rainfall during this period, between 67 mm (2.6 in) and 83 mm (3.3 in). Ready to plan your travels but need destination ideas? Our smart tool recommends places based on the climate conditions you prefer. Start planning with our destination weather tool.
Frequently asked questions about the climate in Cadzand-Bad
What is the best time to visit Cadzand-Bad?
June, July, August and September typically offer the most optimal weather in Cadzand-Bad. In contrast, January, February and December tend to have less optimal conditions.
What temperatures can I expect in Cadzand-Bad?
Daytime highs range from 8°C (46°F) in February to 22°C (72°F) in August. Nighttime lows range from 3°C (37°F) to 16°C (61°F). Temperatures vary considerably through the year.
How much rain does Cadzand-Bad get?
Annual rainfall is around 869 mm (34 in). December is the wettest month with 86 mm (3.4 in), while April is the driest with 52 mm (2 in).
How sunny is Cadzand-Bad?
Cadzand-Bad receives around 1,910 hours of sunshine per year. May is the sunniest month with 236 hours, while December is the cloudiest with just 64 hours.
Cadzand-Bad 3-Day Forecast
Cadzand-Bad 3-Day Forecast
Cadzand-Bad on the map
Cadzand-Bad is highlighted — select any city to see its climate.
Popular this month
Where to go in July — average daytime high across popular destinations.
Bucket list
Need travel inspiration? Check out our bucket list articles and be inspired.
 Flower fields in the Netherlands
The flower fields in The Netherlands are world famous. The red, pink and yellow colors are breathtakingly beautiful and should be on the bucket list.
Pride in Amsterdam
Nowhere in the world is Pride being celebrated on the water on such a scale as in Amsterdam. It is an unique experience that every person needs to add to his, her or its bucket list.
The greenest experience of Amsterdam
If you’re looking for an experience of Amsterdam that is rooted in nature, that can help you go outside and get your hands dirty, then these tips are for you.
Amsterdam Dance Event
ADE is one of the larger festival giants, but you may never have heard of it if you are not an electronic music fan. It last five days and takes place in October.