Cabo Negro Weather & Climate: Best Time to Visit
Average temperatures, rainfall, sunshine and the best time to visit Cabo Negro.
Climate overview of Cabo Negro
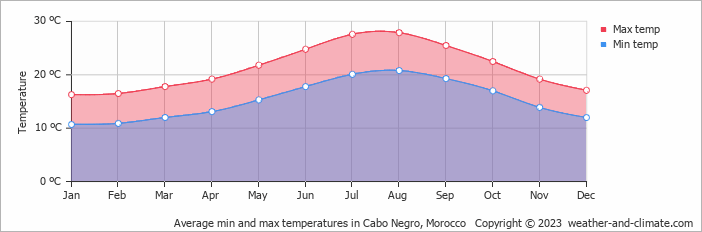
Cabo Negro, Tanger-Tetouan-Al Hoceïma, Morocco, sees big temperature differences between seasons, with August peaking at 28°C (82°F) and January dropping to 16°C (61°F).
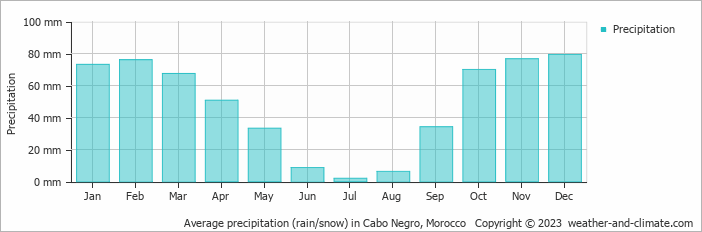
The city receives around 577 mm (23 in) of rainfall per year. It experiences a distinct dry season from May to September, with warm summers and mild winters. December is the wettest month and July the driest. Sunshine peaks in July, when the city sees around 10.9 hours of sunshine per day.
Cabo Negro Weather by Month
Pick a month to see the average temperature, rainfall and sunshine in Cabo Negro - and find the best time to visit.
Monthly Temperature in Cabo Negro
Visitors to Cabo Negro can expect significant temperature changes throughout the year. On average, daytime temperatures range from a comfortable 28°C (82°F) in August to a moderate 16°C (61°F) in January.
Nighttime temperatures range from 21°C (70°F) in August to 11°C (52°F) in January.
Check out our detailed temperature page for more information.
Temperature ranges by month
Rainfall in Cabo Negro
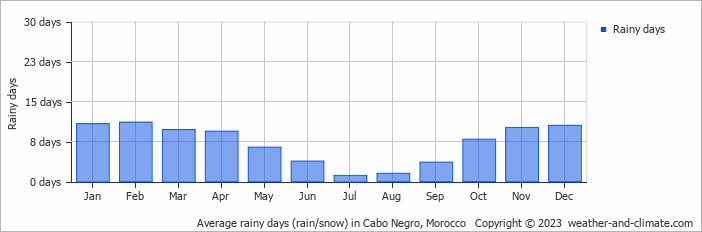
Generally, Cabo Negro experiences moderate precipitation patterns, averaging 577 mm (23 in) yearly. The seasons in Cabo Negro bring significant changes in precipitation. The wettest month, December, receives moderate rainfall, with an average of 79 mm (3.1 in) of precipitation. This rainfall is distributed across 11 rainy days.
In contrast, the driest month, July, experiences much less rainfall, totaling 1.9 mm (0.1 in) over a single rainy day. These distinct seasonal differences provide diverse experiences throughout the year. For more details, please visit our Cabo Negro Precipitation page.
The mean monthly precipitation over the year, including rain, hail, and snow
The average number of days each month with precipitation
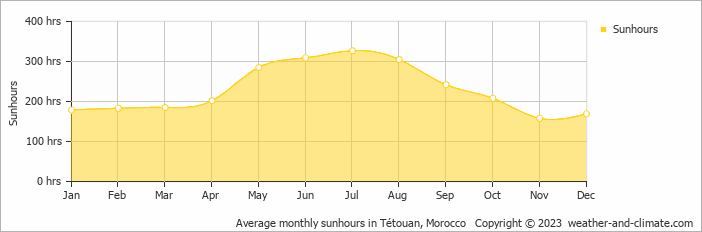
Sunshine Hours in Cabo Negro
In Cabo Negro, summer days are longer and more sunny, with daily sunshine hours peaking at 10.9 hours in July. As the darker season arrives, the brightness of the sun becomes less. November sees a soft sun for only 5.3 hours per average day.
Visit our detailed sunshine hours page for more information.
Monthly hours of sunshine
Daily hours of sunshine
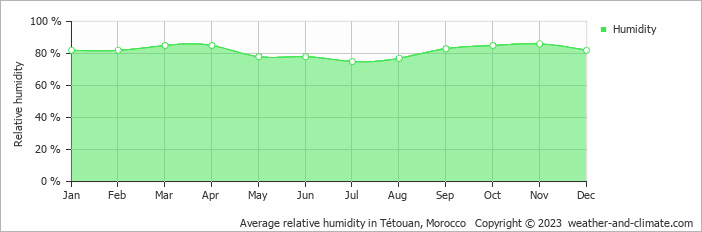
Humidity in Cabo Negro by Month
The city experiences its highest humidity in November, reaching 86%. In July, the humidity drops to its lowest level at 75%. What does this mean? Read our detailed page on humidity levels for further details.
Relative humidity over the year
Best Time to Visit Cabo Negro
Monthly ratings reflect general weather comfort, based on daytime temperature and rainfall. Swimming and winter conditions are highlighted separately where relevant.
- Best overall: May, June, July, August, September and October
- Warmest weather: July and August
- Most sunshine: July
- Fewest rainy days: July and August
- Seasonal pattern: A distinct dry season from May to September, with warm summers and mild winters
Frequently asked questions about the climate in Cabo Negro
What is the best time to visit Cabo Negro?
May, June, July, August, September and October typically offer the most optimal weather in Cabo Negro. In contrast, January, February and December tend to have less optimal conditions. Cabo Negro has a distinct dry season from May to September, with warm summers and mild winters.
What temperatures can I expect in Cabo Negro?
Daytime highs range from 16°C (61°F) in January to 28°C (82°F) in August. Nighttime lows range from 11°C (52°F) to 21°C (70°F). Temperatures vary considerably through the year.
How much rain does Cabo Negro get?
Annual rainfall is around 577 mm (23 in). December is the wettest month with 79 mm (3.1 in), while July is the driest with 1.9 mm (0.1 in).
How sunny is Cabo Negro?
Cabo Negro receives around 2,752 hours of sunshine per year. July is the sunniest month with 327 hours, while November is the cloudiest with just 158 hours. Overall, Cabo Negro enjoys abundant sunshine.
Cabo Negro 3-Day Forecast
Cabo Negro 3-Day Forecast
Cabo Negro on the map
Cabo Negro is highlighted - select any city to see its climate.
Popular this month
Where to go in July - average daytime high across popular destinations.
Bucket list
Need travel inspiration? Check out our bucket list articles and be inspired.