Bundaberg Weather & Climate: Best Time to Visit
Average temperatures, rainfall, sunshine and the best time to visit Bundaberg.
Climate overview of Bundaberg
Bundaberg, Queensland, Australia, has a moderate seasonal temperature range, with January reaching 30°C (86°F) and July cooling to 22°C (72°F).
With around 893 mm (35 in) of annual rainfall, the city has moderate precipitation levels. February is the wettest month and September the driest. It also has a distinct dry season from July to September.
Bundaberg Weather by Month
Pick a month to see the average temperature, rainfall and sunshine in Bundaberg — and find the best time to visit.
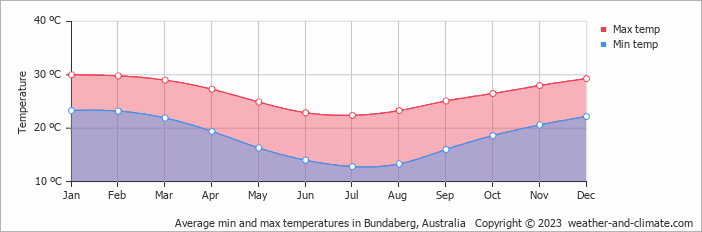
Monthly Temperature in Bundaberg
In Bundaberg, seasonal changes bring about a moderate variation in temperatures. Typically, average maximum daytime temperatures range from a very warm 30°C (86°F) in January to a comfortable 22°C (72°F) in the coolest month, July.
Nights vary from 23°C (73°F) in January to around 13°C (55°F) during the colder months.
Check out our detailed temperature page for more information.
Temperature ranges by month
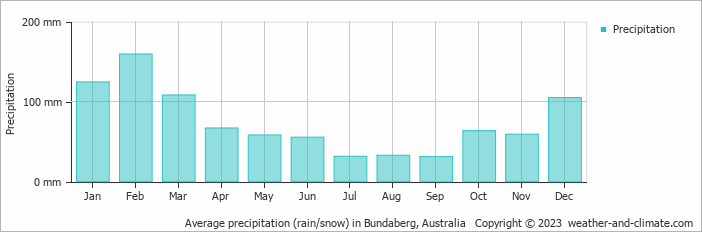
Rainfall in Bundaberg
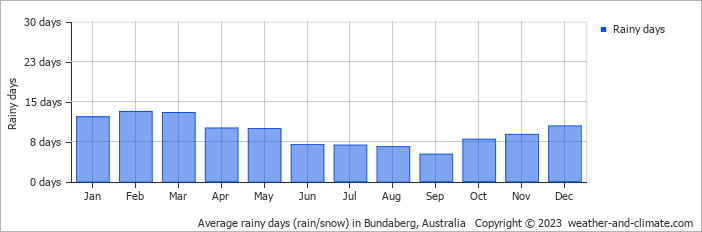
Generally, Bundaberg experiences moderate precipitation patterns, averaging 893 mm (35 in) yearly. The climate in Bundaberg shows significant variation throughout the year. Expect high rainfall in February, the wettest month, with an average of 159 mm (6.3 in) of precipitation over 13 rainy days.
In contrast, the driest month September offers drier and sunnier days, with around 31 mm (1.2 in) of rainfall over 5 rainy days. For more details, please visit our Bundaberg Precipitation page.
The mean monthly precipitation over the year, including rain, hail, and snow
The average number of days each month with precipitation
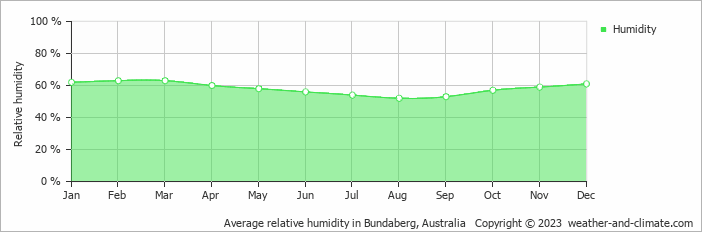
Humidity in Bundaberg by Month
The relative humidity is moderate throughout the year in Bundaberg.
The city experiences its highest humidity in February, reaching 63%. In August, the humidity drops to its lowest level at 52%. What does this mean? Read our detailed page on humidity levels for further details.
Relative humidity over the year
Best Time to Visit Bundaberg
The weather does bring rainfall during this period, between 31 mm (1.2 in) and 63 mm (2.5 in). Wondering where to travel based on your weather preferences? Our recommendation tool helps you find destinations with your ideal climate conditions. Use our weather planner to find your perfect destination.
Frequently asked questions about the climate in Bundaberg
What is the best time to visit Bundaberg?
April, May, June, July, August, September, October and November typically offer the most optimal weather in Bundaberg. In contrast, January and February tend to have less optimal conditions. Bundaberg has a distinct dry season from July to September.
What temperatures can I expect in Bundaberg?
Daytime highs range from 22°C (72°F) in July to 30°C (86°F) in January. Nighttime lows range from 13°C (55°F) to 23°C (73°F).
How much rain does Bundaberg get?
Annual rainfall is around 893 mm (35 in). February is the wettest month with 159 mm (6.3 in), while September is the driest with 31 mm (1.2 in).
Bundaberg 3-Day Forecast
Bundaberg 3-Day Forecast
Bundaberg on the map
Bundaberg is highlighted — select any city to see its climate.
Popular this month
Where to go in July — average daytime high across popular destinations.
Bucket list
Need travel inspiration? Check out our bucket list articles and be inspired.
 An alternative way to discover Sydney
We have made an overview of the sights in Sydney that you must see if you want to visit Sydney in an alternative way.
The most relaxed and alternative area of Australia is called the Byron Shire
The Byron Shire is one of the most pretty areas in the world. Not only in terms on natural beauty, also the relaxed vibe and people make this an area that remains close to your heart.
Sail the Whitsunday islands
The best travel period to sail the Whitsunday islands is “winter” between June and October, with pleasant temperatures around 23 degrees Celsius (74 Fahrenheit).
The best dive spots in Australia
Explore Australia's best dive spots: from the Great Barrier Reef to HMAS Perth. Discover vibrant corals, marine life, and historic wrecks.