Aljmaš Weather & Climate: Best Time to Visit
Average temperatures, rainfall, sunshine and the best time to visit Aljmaš.
Climate overview of Aljmaš
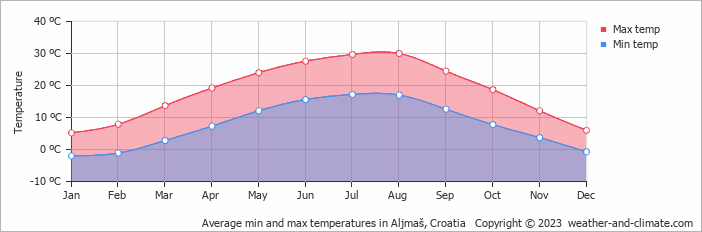
The climate in Aljmaš, Osječko-baranjska županija, Croatia, is marked by large temperature swings across the seasons, ranging from 30°C (86°F) in August to 5°C (41°F) in January.
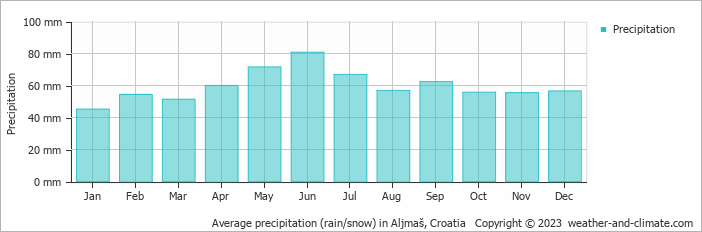
With around 716 mm (28 in) of annual rain/snowfall, the city has moderate precipitation levels. June is the wettest month and January the driest.
Aljmaš Weather by Month
Pick a month to see the average temperature, rainfall and sunshine in Aljmaš — and find the best time to visit.
Monthly Temperature in Aljmaš
In Aljmaš, temperatures differ significantly between summer and winter months. Typically, average maximum daytime temperatures range from a very warm 30°C (86°F) in August to a chilly 5°C (41°F) in the coolest month, January.
Nights vary from 17°C (63°F) in August to around -2°C (28°F) during the colder months.
Check out our detailed temperature page for more information.
Temperature ranges by month
Rainfall in Aljmaš
On average, Aljmaš receives a reasonable amount of rain/snowfall, with an annual precipitation of 716 mm (28 in). Aljmaš offers a pleasant mix of wetter and slightly drier months. The difference in precipitation between the wettest month June (81 mm (3.2 in)) and the driest month January (45 mm (1.8 in)) is not too significant. For more details, please visit our Aljmaš Precipitation page.
The mean monthly precipitation over the year, including rain, hail, and snow
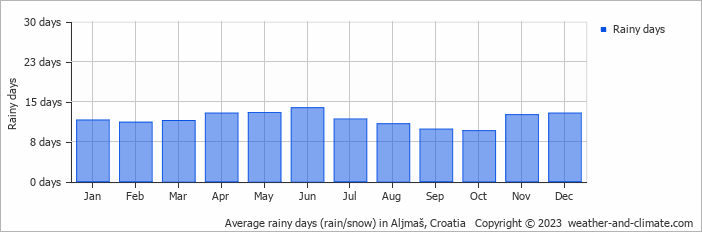
The average number of days each month with precipitation
Best Time to Visit Aljmaš
Frequently asked questions about the climate in Aljmaš
What is the best time to visit Aljmaš?
May, June and September typically offer the most optimal weather in Aljmaš. In contrast, January, February and December tend to have less optimal conditions.
What temperatures can I expect in Aljmaš?
Daytime highs range from 5°C (41°F) in January to 30°C (86°F) in August. Nighttime lows range from -2°C (28°F) to 17°C (63°F). Temperatures vary considerably through the year.
How much rain does Aljmaš get?
Annual rainfall is around 716 mm (28 in). June is the wettest month with 81 mm (3.2 in), while January is the driest with 45 mm (1.8 in).
Aljmaš 3-Day Forecast
Aljmaš 3-Day Forecast
Aljmaš on the map
Aljmaš is highlighted — select any city to see its climate.
Popular this month
Where to go in July — average daytime high across popular destinations.
Bucket list
Need travel inspiration? Check out our bucket list articles and be inspired.
 Magical Split
The best travel time to Split in Croatia is from May til October and the best months are May, June and September.
Sail the crystal-clear waters of Croatia and enjoy its stunning coastline
Croatia is an idyllic sailing destination, boasting 1,777 miles (2,860 km) of beautiful beaches and pristine waters. With over 1,000 Islands dotting the Adriatic Sea, there's a perfect spot for everyone.
 Cycle the Danube trail
The Danube cycle route is one of the most popular cycling routes in Europe, and rightly so, because it is a varied route that is interesting both in terms of culture and nature.