Agua de Fontanales Weather & Climate: Best Time to Visit
Average temperatures, rainfall, sunshine and the best time to visit Agua de Fontanales.
Climate overview of Agua de Fontanales
With consistently stable weather, Agua de Fontanales, Canary Islands, Spain, sees little seasonal temperature change. Daytime highs average 22°C (72°F), ranging from 25°C (77°F) in August to 19°C (66°F) in February.
With just 244 mm (9.6 in) of annual rainfall, the city has a dry, desert-like climate. July is the sunniest month, averaging 10.4 hours of sunshine per day.
Agua de Fontanales Weather by Month
Pick a month to see the average temperature, rainfall and sunshine in Agua de Fontanales — and find the best time to visit.
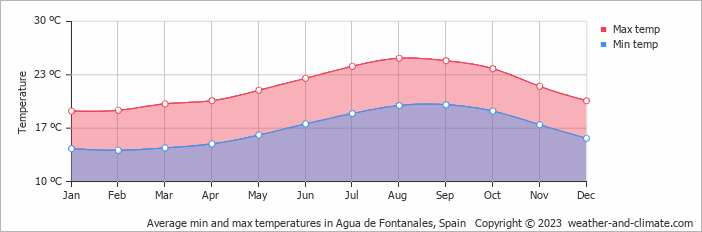
Monthly Temperature in Agua de Fontanales
The climate in Agua de Fontanales remains fairly constant, offering pleasant temperatures throughout the year. Average daytime temperatures reach a comfortable 25°C (77°F) in August. In February, the coolest month of the year, temperatures drop to a pleasant 19°C (66°F).
At night, temperatures range from around 20°C (68°F) in August to 14°C (57°F) in February.
Check out our detailed temperature page for more information.
Temperature ranges by month
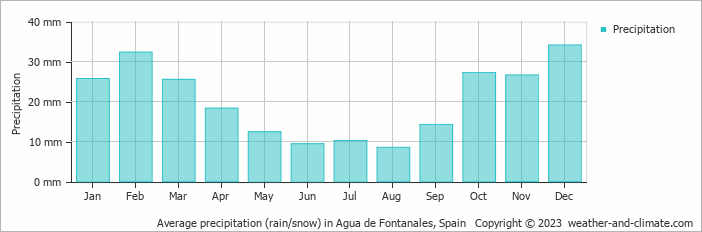
Rainfall in Agua de Fontanales
Agua de Fontanales experiences desert-like conditions in terms of precipitation with almost no rainfall, generally receiving 244 mm (9.6 in) annually. Agua de Fontanales can be quite wet during December, receiving approximately 34 mm (1.3 in) of precipitation over 5 rainy days.
In contrast, during the driest month (August), you will experience much drier conditions, with 8.5 mm (0.3 in) of precipitation spread across a single rainy day days. For more details, please visit our Agua de Fontanales Precipitation page.
The mean monthly precipitation over the year, including rain, hail, and snow
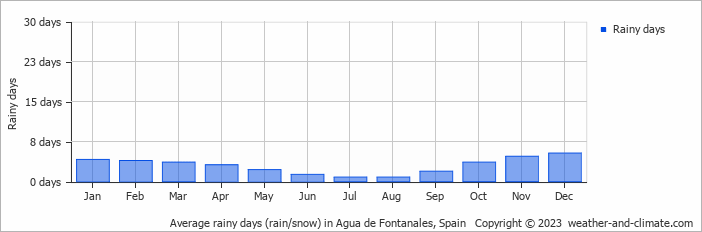
The average number of days each month with precipitation
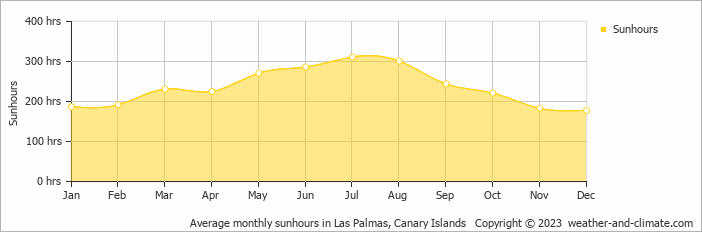
Sunshine Hours in Agua de Fontanales
Agua de Fontanales can be enjoyed more throughout the sunniest month of July under a blue sky, with approximately 10.4 hours of sunshine daily. In contrast, the city experiences much darker days in December, with only 5.9 hours of sunlight per day.
Visit our detailed sunshine hours page for more information.
Monthly hours of sunshine
Daily hours of sunshine
Daily percentage of sunshine
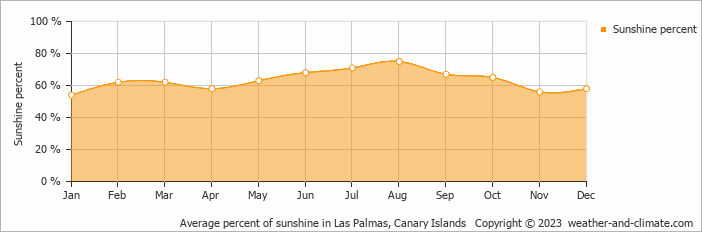
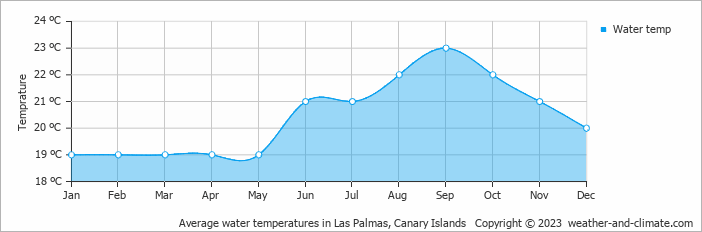
Water Temperature in Agua de Fontanales
The mean water temperature over the year ranges from 19°C (66°F) in January to 23°C (73°F) in September.
Water temperature over the year
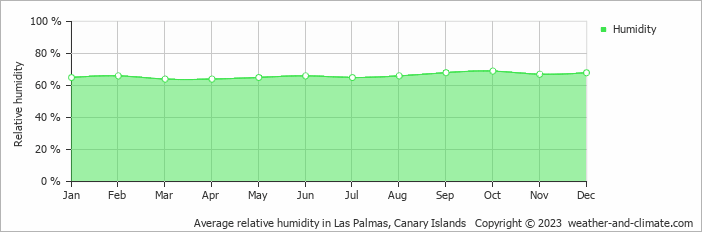
Humidity in Agua de Fontanales by Month
The relative humidity is high throughout the year in Agua de Fontanales.
The city experiences its highest humidity in October, reaching 69%. In March, the humidity drops to its lowest level at 64%. What does this mean? Read our detailed page on humidity levels for further details.
Relative humidity over the year
Best Time to Visit Agua de Fontanales
While you can visit anytime with confidence, the drier months like August (with just 9 mm (0.4 in) rainfall) provide the most favorable conditions for extended outdoor exploration and flexible itineraries. Ready to plan your travels but need destination ideas? Our smart tool recommends places based on the climate conditions you prefer. Start planning with our destination weather tool.
Frequently asked questions about the climate in Agua de Fontanales
What is the best time to visit Agua de Fontanales?
January, March, April, May, June, July, August, September, October, November and December typically offer the most optimal weather in Agua de Fontanales. In contrast, February tends to have less optimal conditions. Agua de Fontanales has a distinct dry season from January to December.
What temperatures can I expect in Agua de Fontanales?
Daytime highs range from 19°C (66°F) in February to 25°C (77°F) in August. Nighttime lows range from 14°C (57°F) to 20°C (68°F). Temperatures stay relatively stable year-round.
How much rain does Agua de Fontanales get?
Annual rainfall is around 244 mm (9.6 in). December is the wettest month with 34 mm (1.3 in), while August is the driest with 8.5 mm (0.3 in).
How sunny is Agua de Fontanales?
Agua de Fontanales receives around 2,830 hours of sunshine per year. July is the sunniest month with 311 hours, while December is the cloudiest with just 178 hours. Overall, Agua de Fontanales enjoys abundant sunshine.
Agua de Fontanales 3-Day Forecast
Agua de Fontanales 3-Day Forecast
Agua de Fontanales on the map
Agua de Fontanales is highlighted — select any city to see its climate.
Popular this month
Where to go in July — average daytime high across popular destinations.
Bucket list
Need travel inspiration? Check out our bucket list articles and be inspired.
 El Hierro: The smallest Canary island without mass tourism
Mainly nature lovers and those seeking tranquility go to El Hierro. The island is know for its beautiful mountains and you can wonder around for days here.
Visit national Park El Teide
This national park is truly a unique place that you should not miss. You will find landscapes that seem to come from another plane and you will feel tiny in these impressive surroundings.
Sevilla: A Blend of Tradition, Culture, and Hidden Gems
Experience Sevilla in spring with Semana Santa processions and Feria de Abril festivities, set against the city's iconic landmarks and vibrant culture.
Enjoy an active trip in the mountains of Sierras de Cazorla
The mountains of Sierras de Cazorla offer spectacular views and sights and an abundance of activities that you can engage in, most of which are eco-friendly!