Ushuaia Weather & Climate: Best Time to Visit
Average temperatures, rainfall, sunshine and the best time to visit Ushuaia.
Climate overview of Ushuaia
The climate in Ushuaia, Tierra del Fuego, Argentina, sees a moderate range of temperatures across the year, from 12°C (54°F) in January down to 2°C (36°F) in July.
The city receives considerable rain/snowfall, with around 1031 mm (41 in) annually. January is the wettest month. November is the sunniest month, averaging 6.1 hours of sunshine per day.
Ushuaia Weather by Month
Pick a month to see the average temperature, rainfall and sunshine in Ushuaia — and find the best time to visit.
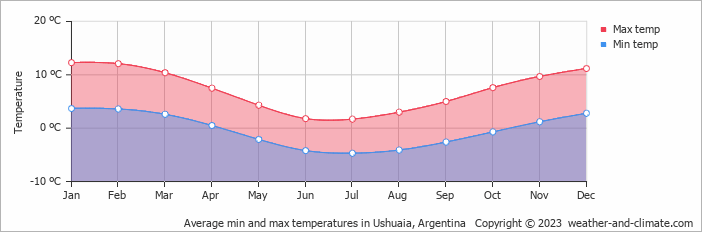
Monthly Temperature in Ushuaia
In Ushuaia, seasonal changes bring about a moderate variation in temperatures. Typically, average maximum daytime temperatures range from a moderate 12°C (54°F) in January to a very cold 2°C (36°F) in the coolest month, July.
Nights vary from 4°C (39°F) in January to around -5°C (23°F) during the colder months.
Check out our detailed temperature page for more information.
Temperature ranges by month
Rainfall in Ushuaia
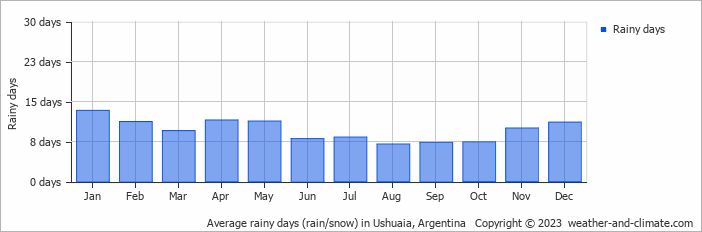
Ushuaia experiences significant rain/snowfall throughout the year, averaging 1031 mm (41 in) of precipitation annually. Ushuaia offers a pleasant mix of wetter and slightly drier months. The difference in precipitation between the wettest month January (120 mm (4.7 in)) and the driest month July (65 mm (2.6 in)) is not too significant. For more details, please visit our Ushuaia Precipitation page.
The mean monthly precipitation over the year, including rain, hail, and snow

The average number of days each month with precipitation
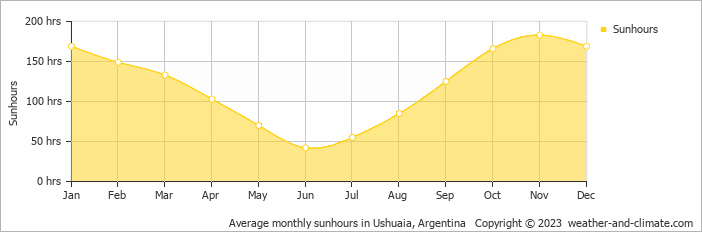
Sunshine Hours in Ushuaia
For those who appreciate different seasons, Ushuaia serves as an ideal destination. Expect longer, more sun-filled days in November with an average of 6.1 hours of sunshine daily, and embrace the darker days in June, offering only 1.4 hours of daily sunlight.
Visit our detailed sunshine hours page for more information.
Monthly hours of sunshine
Daily hours of sunshine
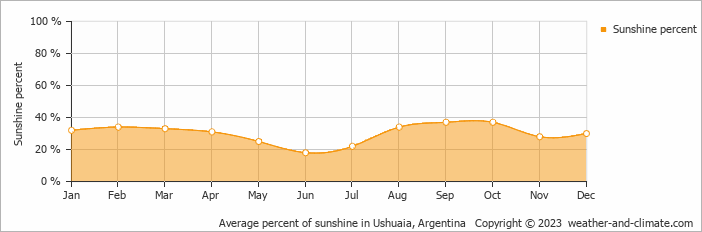
Daily percentage of sunshine
Humidity in Ushuaia by Month
The relative humidity is high throughout the year in Ushuaia.
The city experiences its highest humidity in June, reaching 82%. In November, the humidity drops to its lowest level at 72%. What does this mean? Read our detailed page on humidity levels for further details.
Relative humidity over the year

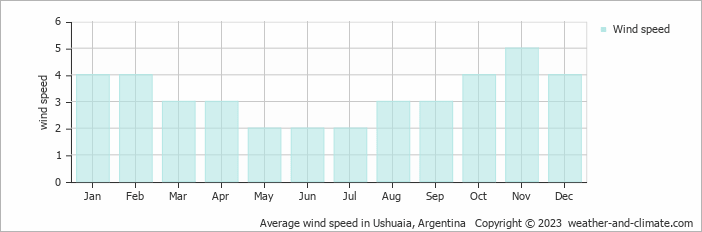
Wind Speed in Ushuaia
The average wind speed over the year ranges from 2 m/s (4 knots) to 5 m/s (10 knots). It is lower in May, June and July and higher in November. What does this mean?
The mean monthly wind speed over the year (meters per second)
Best Time to Visit Ushuaia
Frequently asked questions about the climate in Ushuaia
What temperatures can I expect in Ushuaia?
Daytime highs range from 2°C (36°F) in July to 12°C (54°F) in January. Nighttime lows range from -5°C (23°F) to 4°C (39°F).
How much rain does Ushuaia get?
Annual rainfall is around 1031 mm (41 in). January is the wettest month with 120 mm (4.7 in), while July is the driest with 65 mm (2.6 in).
How sunny is Ushuaia?
Ushuaia receives around 1,449 hours of sunshine per year. November is the sunniest month with 183 hours, while June is the cloudiest with just 42 hours.
Ushuaia 3-Day Forecast
Ushuaia 3-Day Forecast
Ushuaia on the map
Ushuaia is highlighted — select any city to see its climate.
Popular this month
Where to go in July — average daytime high across popular destinations.
Bucket list
Need travel inspiration? Check out our bucket list articles and be inspired.
 The 10 most alternative cities in South America
Discover South America's top 10 alternative cities! From Valparaíso's vibrant streets to La Paz's high-altitude charm and Medellín's innovative spirit.
Be amazed by Buenos Aires
The city of beautiful museums, cute streets, green parks, lots of good food, interesting local neighborhoods and impressive historical buildings.
Explore Patagonia
A tour through Patagonia brings you to the end of the world. That’s why Patagonia is a bucket list destination for many. We recommend to visit Patagonia from November to early March.
Glacier walk on The Perito Moreno glacier
The Perito Moreno glacier and the rupture of this glacier is considered one of the most impressive natural spectacles in the world. You can wait here until a large piece of ice crumbles and plunges into the water with a lot of noise.