Monthly Average Rainy days in Quito
The number of days each month with rain, snow and hail in Quito (), Ecuador.
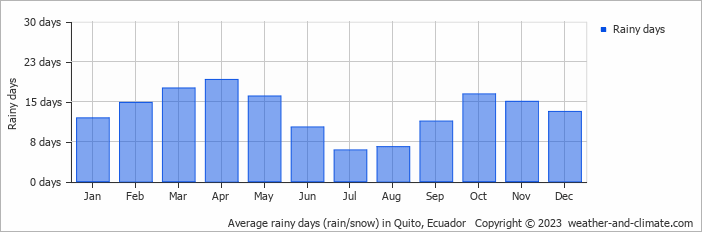
- Most rainy days are in March, April, May, October and November.
- On average, April is the most rainy with 19 days of rain/snow.
- On average, July is the driest month with 5 rainy days.
- The average annual number of rainy days is 157.
Current rainfall in Quito
Wed Jan 15
18°C | 9°C
NE  2 m/s
2 m/s
2 m/s11 mm
partly cloudy and thunder
Thu Jan 16
18°C | 9°C
N 2 m/s
2 m/s13 mm
broken clouds and rain
Fri Jan 17
17°C | 9°C
N 1 m/s
1 m/s17 mm
overcast and thunder


