Paso de los Toros Weather & Climate: Best Time to Visit
Average temperatures, rainfall, sunshine and the best time to visit Paso de los Toros.
Climate overview of Paso de los Toros
Paso de los Toros, Canelones, Uruguay, sees big temperature differences between seasons, with January peaking at 31°C (88°F) and July dropping to 17°C (63°F).
Rainfall is high, totalling around 1318 mm (52 in) per year. April is the wettest month and July the driest. December is the sunniest month, averaging 9.6 hours of sunshine per day.
Paso de los Toros Weather by Month
Pick a month to see the average temperature, rainfall and sunshine in Paso de los Toros — and find the best time to visit.
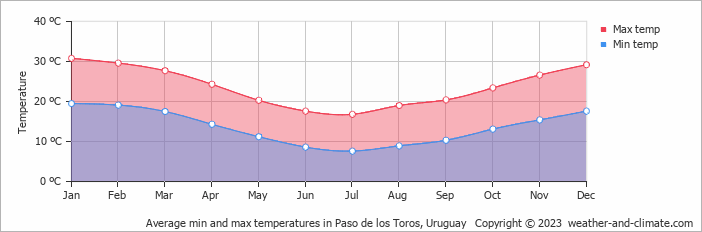
Monthly Temperature in Paso de los Toros
Visitors to Paso de los Toros can expect significant temperature changes throughout the year. Average maximum daytime temperatures range from a very warm 31°C (88°F) in January, the warmest time of the year, to a moderate 17°C (63°F) during cooler months like July.
At night, you can expect temperatures ranging from 20°C (68°F) in January to around 8°C (46°F) during July.
Check out our detailed temperature page for more information.
Temperature ranges by month
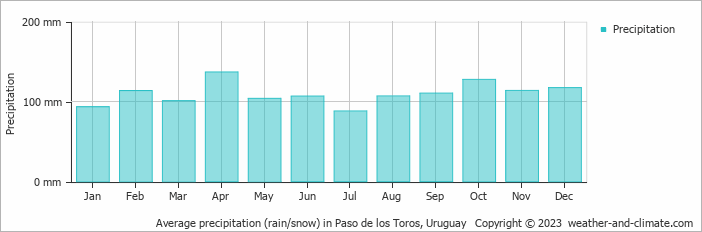
Rainfall in Paso de los Toros
Paso de los Toros is known for its substantial rainfall, with annual precipitation reaching 1318 mm (52 in). Year-round, Paso de los Toros has a balanced climate with minimal variation in precipitation. The difference between the wettest month, April, with 137 mm (5.4 in), and the driest month, July, with 88 mm (3.5 in), is minimal. For more details, please visit our Paso de los Toros Precipitation page.
The mean monthly precipitation over the year, including rain, hail, and snow
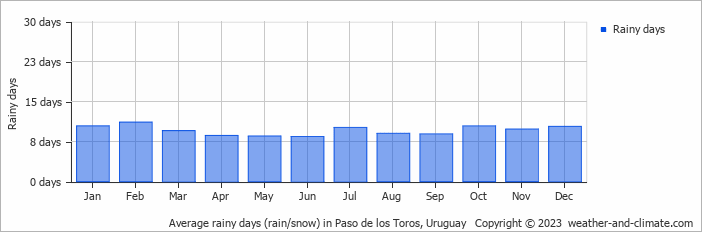
The average number of days each month with precipitation
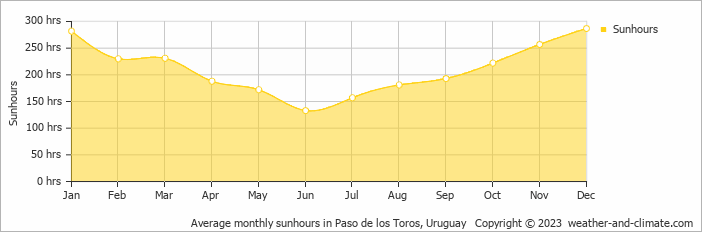
Sunshine Hours in Paso de los Toros
Seasonal changes in sunshine hours are quite dramatic in Paso de los Toros. While December receives considerable daily sunshine with up to 9.6 hours, June marks the darkest time of the year, where sunshine is scarce with only 4.4 hours of sunlight per day.
Visit our detailed sunshine hours page for more information.
Monthly hours of sunshine
Daily hours of sunshine
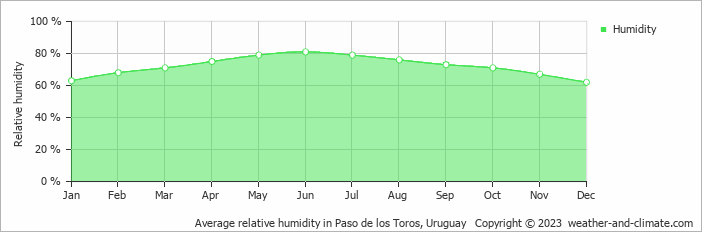
Humidity in Paso de los Toros by Month
The relative humidity is high throughout the year in Paso de los Toros.
The city experiences its highest humidity in June, reaching 81%. In December, the humidity drops to its lowest level at 62%. What does this mean? Read our detailed page on humidity levels for further details.
Relative humidity over the year
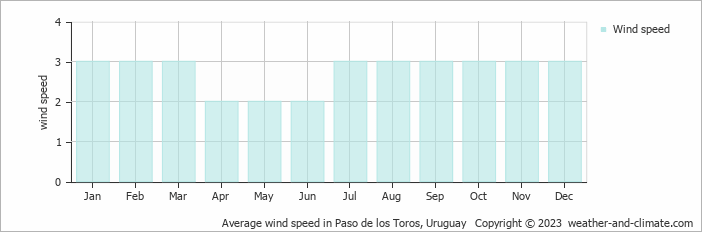
Wind Speed in Paso de los Toros
The mean wind speed varies between 2 m/s (4 knots) and 3 m/s (6 knots) throughout the year. It is lowest in April, May and June and highest during January, February, March, July, August, September, October, November and December. What does this mean?
The mean monthly wind speed over the year (meters per second)
Best Time to Visit Paso de los Toros
The weather does bring rainfall during this period, between 104 mm (4.1 in) and 114 mm (4.5 in). Need help choosing your next travel destination? We offer a specialized tool that matches you with locations based on your weather preferences. Explore destinations that suit your climate preferences.
Frequently asked questions about the climate in Paso de los Toros
What is the best time to visit Paso de los Toros?
March, April, May, September, October, November and December typically offer the most optimal weather in Paso de los Toros. In contrast, February tends to have less optimal conditions.
What temperatures can I expect in Paso de los Toros?
Daytime highs range from 17°C (63°F) in July to 31°C (88°F) in January. Nighttime lows range from 8°C (46°F) to 20°C (68°F). Temperatures vary considerably through the year.
How much rain does Paso de los Toros get?
Annual rainfall is around 1318 mm (52 in). April is the wettest month with 137 mm (5.4 in), while July is the driest with 88 mm (3.5 in).
How sunny is Paso de los Toros?
Paso de los Toros receives around 2,533 hours of sunshine per year. December is the sunniest month with 287 hours, while June is the cloudiest with just 133 hours. Overall, Paso de los Toros enjoys abundant sunshine.
Paso de los Toros 3-Day Forecast
Paso de los Toros 3-Day Forecast
Paso de los Toros on the map
Paso de los Toros is highlighted — select any city to see its climate.
Popular this month
Where to go in June — average daytime high across popular destinations.
Bucket list
Need travel inspiration? Check out our bucket list articles and be inspired.
 The 10 most alternative cities in South America
Discover South America's top 10 alternative cities! From Valparaíso's vibrant streets to La Paz's high-altitude charm and Medellín's innovative spirit.
 Carmelo is the best kept secret of Uruguay
With its natural beauty and history, Carmelo is an inviting place to visit. Enjoy nature, tranquility, authenticity, the 'wine' and activities such as cycling, walking and horse riding.