Dori Weather & Climate: Best Time to Visit
Average temperatures, rainfall, sunshine and the best time to visit Dori.
Climate overview of Dori
Dori, Burkina Faso, experiences moderate temperature changes through the seasons. April is the warmest month with daytime highs of 42°C (108°F), while January is the coolest at 32°C (90°F).
Rainfall is modest, totalling around 299 mm (12 in) annually. The city experiences a distinct dry season from October to June. August tends to be the wettest month. The most sunshine falls in October, with an average of 10.1 hours of daily sunshine.
Dori Weather by Month
Pick a month to see the average temperature, rainfall and sunshine in Dori — and find the best time to visit.
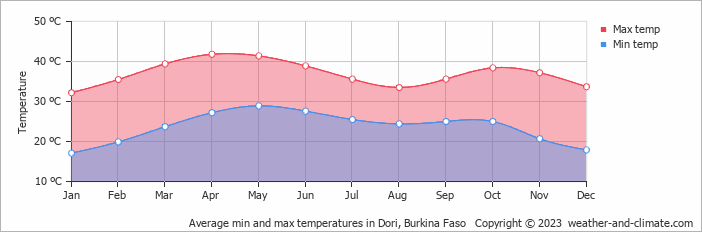
Monthly Temperature in Dori
The weather in Dori changes moderately throughout the year, offering enough variation to appreciate each season. Average maximum daytime temperatures range from a very hot 42°C (108°F) in April, the warmest time of the year, to a very warm 32°C (90°F) during cooler months like January.
At night, you can expect temperatures ranging from 29°C (84°F) in April to around 17°C (63°F) during January.
Check out our detailed temperature page for more information.
Temperature ranges by month
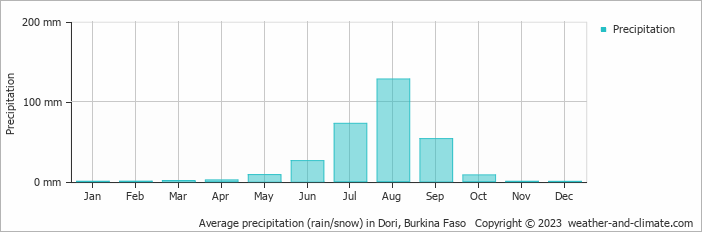
Rainfall in Dori
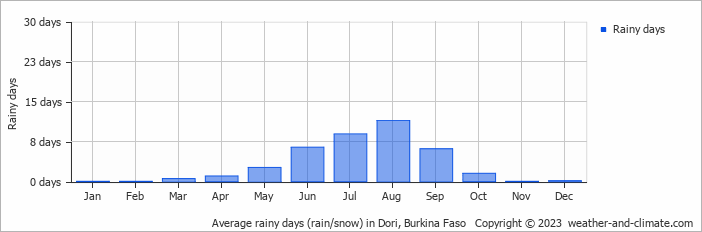
Dori maintains relatively dry conditions year-round, recording average annual precipitation of 299 mm (12 in). Significant seasonal changes in precipitation occur throughout the year. In the wettest month, August it receives high rainfall, averaging 128 mm (5 in) of precipitation, recorded across 11 rainy days. In contrast, the driest month December brings less rainfall, with 0 mm (0 in) over 0 rainy days. For more details, please visit our Dori Precipitation page.
The mean monthly precipitation over the year, including rain, hail, and snow
The average number of days each month with precipitation
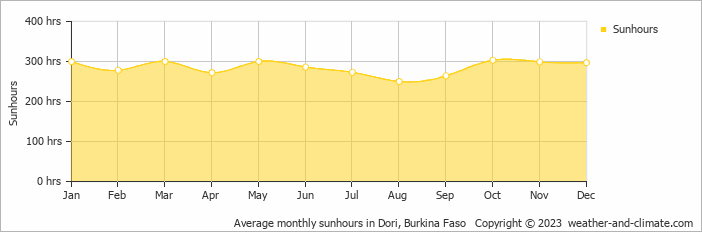
Sunshine Hours in Dori
Year-round, Dori offers plenty of sunlight to enjoy during your holiday. The difference between the sunniest month, October, with 10.1 hours of daily sunshine, and August, the least sunny month, with 8.3 hours, is minimal.
Visit our detailed sunshine hours page for more information.
Monthly hours of sunshine
Daily hours of sunshine
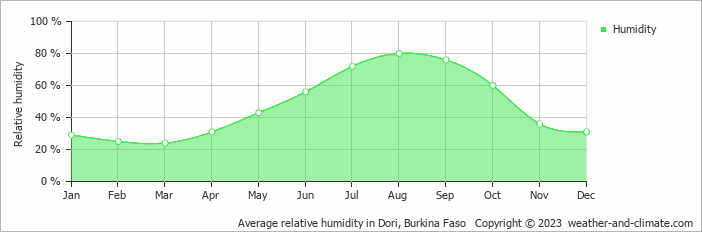
Humidity in Dori by Month
The relative humidity is moderate throughout the year in Dori.
The city experiences its highest humidity in August, reaching 80%. In March, the humidity drops to its lowest level at 24%. What does this mean? Read our detailed page on humidity levels for further details.
Relative humidity over the year
Best Time to Visit Dori
For a more comfortable experience, start your day early when the weather is cooler, or take advantage of the gentle breezes in the late afternoon. Need help choosing your next travel destination? We offer a specialized tool that matches you with locations based on your weather preferences. Explore destinations that suit your climate preferences.
Frequently asked questions about the climate in Dori
What is the best time to visit Dori?
January typically offers the most optimal weather in Dori. In contrast, February, March, April, May, June, July, August, September, October, November and December tend to have less optimal conditions. Dori has a distinct dry season from October to June.
What temperatures can I expect in Dori?
Daytime highs range from 32°C (90°F) in January to 42°C (108°F) in April. Nighttime lows range from 17°C (63°F) to 29°C (84°F).
How much rain does Dori get?
Annual rainfall is around 299 mm (12 in). August is the wettest month with 128 mm (5 in), while December is the driest with 0 mm (0 in).
How sunny is Dori?
Dori receives around 3,422 hours of sunshine per year. October is the sunniest month with 303 hours, while August is the cloudiest with just 250 hours. Overall, Dori enjoys abundant sunshine.
Dori 3-Day Forecast
Dori 3-Day Forecast
Dori on the map
Dori is highlighted — select any city to see its climate.
Popular this month
Where to go in July — average daytime high across popular destinations.