Barranquila Weather and Climate: A Comprehensive Guide
Barranquila has relatively stable weather with very warm temperatures.
It is also known for its large amounts of rainfall.
Let’s explore the climate details in depth to provide you with a complete overview.
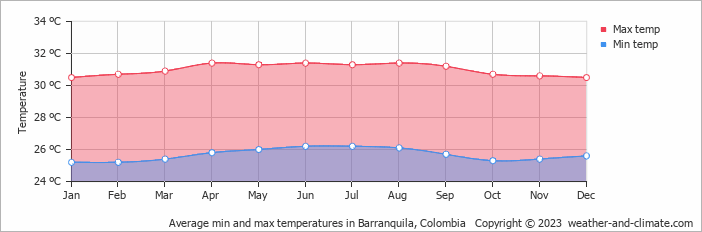
Average maximum day and minimum night temperature
In Barranquila temperatures are generally consistent throughout the year. Typically, average maximum daytime temperatures range from a very warm 31°C in April to a very warm 31°C in the coolest month, January.
Nights are cooler, with lows often dropping to around 25°C during the colder months.Check out our detailed temperature page for more information.
Temperature ranges by month
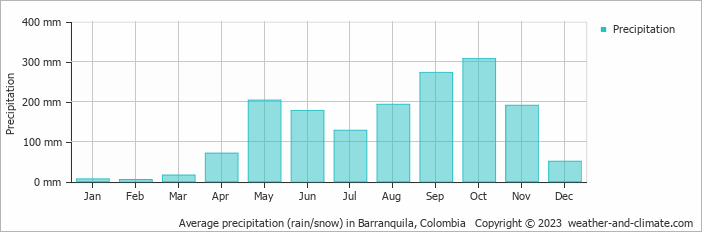
Precipitation and rainy days
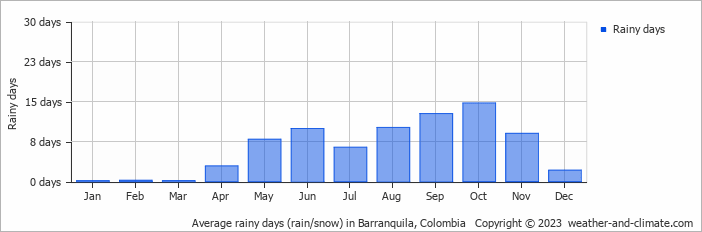
Barranquila experiences significant rainfall throughout the year, averaging 1616 mm of precipitation annually. The climate in Barranquila shows significant variation throughout the year. Expect heavy rainfall in October, with an average of 307 mm of precipitation over 15 rainy days.
In contrast, February offers drier and sunnier days, with around 4.4 mm of rainfall over 0 rainy days. For more details, please visit our Barranquila Precipitation page.The mean monthly precipitation over the year, including rain, hail and snow
The average number of days each month with precipitation
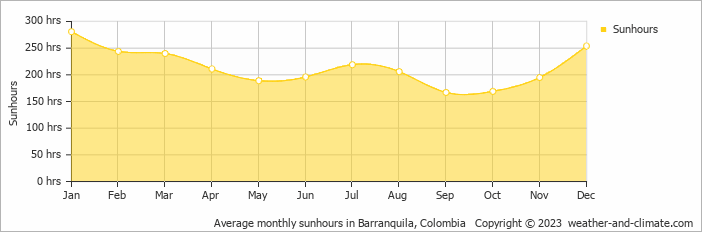
Sunshine over the year
For those who appreciate different seasons, Barranquila serves as an ideal destination. Expect longer, more sun-filled days in January with an average of 9.4 hours of sunshine daily, and embrace the darker days in September, offering only 5.6 hours of daily sunlight.
Visit our detailed sunshine hours page for more information.
Monthly hours of sunshine
Daily hours of sunshine
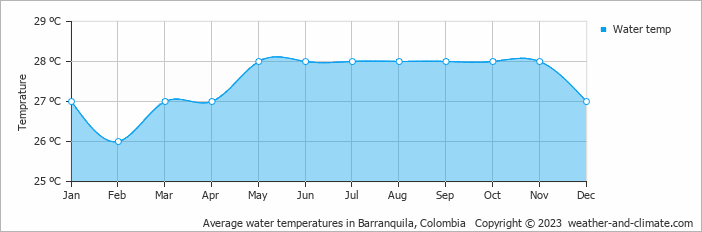
Average water temperature
The mean water temperature over the year ranges from 26°C in February to 28°C in May.
Water temperature over the year
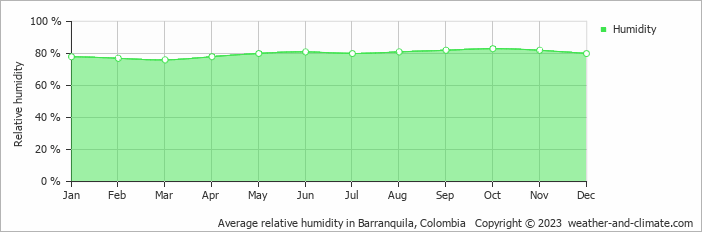
Average humidity
The relative humidity is high throughout the year in Barranquila.
The city experiences its highest humidity in October, reaching 83%. In March, the humidity drops to its lowest level at 76%. What does this mean? Read our detailed page on humidity levels for further details.
Relative humidity over the year
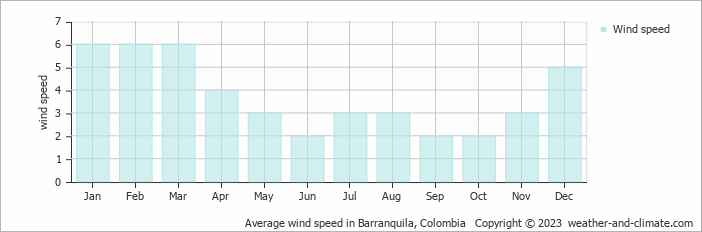
Average wind speed
The mean wind speed varies between 2 m/s and 6 m/s throughout the year. It is lowest in June, September and October and highest during January, February and March.
The mean monthly wind speed over the year (meters per second)
Forecast for Barranquila


Select a Month of Interest
Check the conditions for any month of the year.
The best time of year to visit Barranquila in Colombia
Barranquila has high temperatures year round ranging between 30°C and 31°C.The best time to visit is during the drier months: January, February, March and December.
Other facts from our historical weather data:
Rainy season in Barranquila occurs in the months of May, June, August, September, October and November.
Yes, the months of January, February and March are very dry.
August has an average maximum temperature of 31°C and is the hottest month of the year.
The coolest month is January with an average maximum temperature of 31°C.
October tops the wettest month list with 307 mm of rainfall.
February is the driest month with 4 mm of precipitation.
January is the sunniest month with an average of 281 hours of sunshine.
No idea where to travel to this year? We have a tool that recommends destinations based on your ideal conditions. Find out where to go with our weather planner.


