Average humidity in Umm Al Quwain
On this page you find more information about the monthly relative humidity over the year in Umm Al Quwain (Umm al-Quwain), United Arab Emirates.
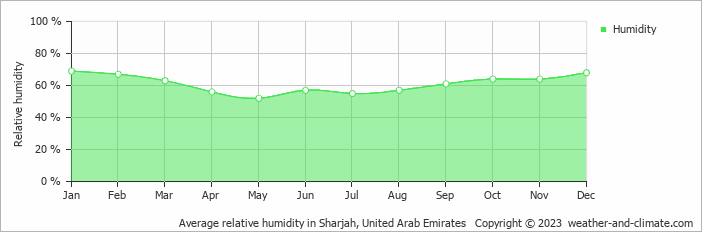
Umm Al Quwain's humidity levels vary throughout the year. The highest levels occur in January, reaching 69% (high), while the lowest is recorded in May at 52%.
Throughout the year, the average humidity in Umm Al Quwain is 61%.
Humidity plays an important role in how temperatures are felt. During the warmest month, August, the maximum average temperature is around 39°C (102°F). During this warm period, the moderate humidity levels have little impact on how the temperature is perceived.
During the coldest month, January, the maximum average temperature is around 24°C (75°F). This period has high humidity. Check out our detailed temperature page for more information.


