Average humidity in Celenza Valfortore
On this page you find more information about the monthly relative humidity over the year in Celenza Valfortore (), Italy.
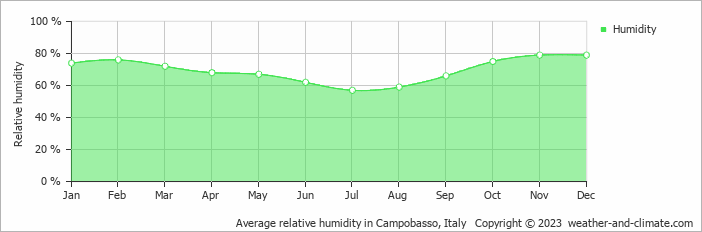
Celenza Valfortore's humidity levels vary throughout the year. The highest levels occur in November, reaching 79% (high), while the lowest is recorded in July at 57%.
Throughout the year, the average humidity in Celenza Valfortore is 70%.
Humidity plays an important role in how temperatures are felt. During the warmest month, August, the maximum average temperature is around 31°C (88°F). During this warm period, the moderate humidity levels have little impact on how the temperature is perceived.
During the coldest month, January, the maximum average temperature is around 11°C (52°F). This period has high humidity. Check out our detailed temperature page for more information.


