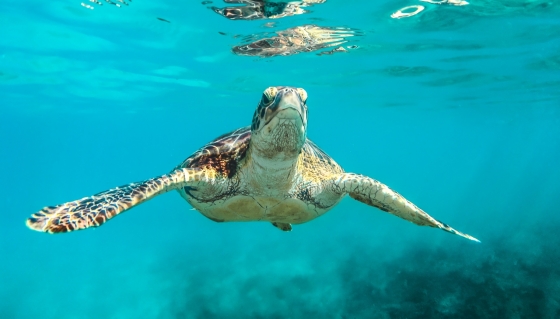
 Spot turtles in Oman
Oman is one of the countries with the most important turtle beaches in the world. April to June offers the best weather and plenty of Turtles.
Al Batinah is a region in Oman. Many people wonder what the weather conditions are in Al Batinah over the year. What is the best time to visit Al Batinah?
This page shows the average weather conditions by month in Al Batinah over the year in: January, February, March, April, May, June, July, August, September, October, November, December.
In January the weather in Al Batinah is generally excellent. January is a winter month. In Sohar you can expect warm maximum average daytime temperatures around 25°C (77°F) and nighttime temperatures around 18°C (64°F). On average, this month is the coldest month of the year in Al Batinah.
Find more detailed climate information for Al Batinah in January here.
Perfect weather is subjective. On this map perfect weather has been defined with temperatures between 20°C (68°F) and 29°C (84°F) and not too much precipitation (less than 90 mm (3.5 in) a month).
Perfect weather is subjective. On this map perfect weather has been defined with temperatures between 20°C (68°F) and 29°C (84°F) and not too much precipitation (less than 90 mm (3.5 in) a month).
Perfect weather is subjective. On this map perfect weather has been defined with temperatures between 20°C (68°F) and 29°C (84°F) and not too much precipitation (less than 90 mm (3.5 in) a month).
In April the weather in Al Batinah is generally excellent. In Sohar you can expect very warm maximum average daytime temperatures around 33°C (91°F) and nighttime temperatures around 25°C (77°F). These night and day temperatures are an average and some days may be even warmer. So be prepared and bring light clothes.
Find more detailed climate information for Al Batinah in April here.
Perfect weather is subjective. On this map perfect weather has been defined with temperatures between 20°C (68°F) and 29°C (84°F) and not too much precipitation (less than 90 mm (3.5 in) a month).
In May the weather in Al Batinah is generally mixed. May is a summer month. In Sohar you can expect very hot maximum average daytime temperatures around 38°C (100°F) and nighttime temperatures around 29°C (84°F). These night and day temperatures are an average and some days may be even warmer. So be prepared and bring light clothes.
Find more detailed climate information for Al Batinah in May here.
Perfect weather is subjective. On this map perfect weather has been defined with temperatures between 20°C (68°F) and 29°C (84°F) and not too much precipitation (less than 90 mm (3.5 in) a month).
In June the weather in Al Batinah is generally mixed. June is a summer month. In Sohar you can expect very hot maximum average daytime temperatures around 38°C (100°F) and nighttime temperatures around 31°C (88°F). On average, this month is one of the warmest months of the year in Al Batinah. So be prepared and make sure to dress lightly.
Find more detailed climate information for Al Batinah in June here.
Perfect weather is subjective. On this map perfect weather has been defined with temperatures between 20°C (68°F) and 29°C (84°F) and not too much precipitation (less than 90 mm (3.5 in) a month).
In July the weather in Al Batinah is generally mixed. July is a summer month. In Sohar you can expect very hot maximum average daytime temperatures around 38°C (100°F) and nighttime temperatures around 32°C (90°F). These night and day temperatures are an average and some days may be even warmer. So be prepared and bring light clothes.
Find more detailed climate information for Al Batinah in July here.
Perfect weather is subjective. On this map perfect weather has been defined with temperatures between 20°C (68°F) and 29°C (84°F) and not too much precipitation (less than 90 mm (3.5 in) a month).
In August the weather in Al Batinah ranges from mixed in Sohar to good in Barka. In Sohar you can expect very hot maximum average daytime temperatures around 37°C (99°F) and nighttime temperatures around 31°C (88°F). These night and day temperatures are an average and some days may be even warmer. So be prepared and bring light clothes.
Find more detailed climate information for Al Batinah in August here.
Perfect weather is subjective. On this map perfect weather has been defined with temperatures between 20°C (68°F) and 29°C (84°F) and not too much precipitation (less than 90 mm (3.5 in) a month).
In September the weather in Al Batinah ranges from mixed in Sohar to very good in Barka. In Sohar you can expect very hot maximum average daytime temperatures around 36°C (97°F) and nighttime temperatures around 29°C (84°F). These night and day temperatures are an average and some days may be even warmer. So be prepared and bring light clothes.
Find more detailed climate information for Al Batinah in September here.
Perfect weather is subjective. On this map perfect weather has been defined with temperatures between 20°C (68°F) and 29°C (84°F) and not too much precipitation (less than 90 mm (3.5 in) a month).
In October the weather in Al Batinah ranges from very good in Sohar to excellent in Barka. In Sohar you can expect very warm maximum average daytime temperatures around 34°C (93°F) and nighttime temperatures around 27°C (81°F). These night and day temperatures are an average and some days may be even warmer. So be prepared and bring light clothes.
Find more detailed climate information for Al Batinah in October here.
Perfect weather is subjective. On this map perfect weather has been defined with temperatures between 20°C (68°F) and 29°C (84°F) and not too much precipitation (less than 90 mm (3.5 in) a month).
In November the weather in Al Batinah is generally excellent. In Sohar you can expect very warm maximum average daytime temperatures around 30°C (86°F) and nighttime temperatures around 23°C (73°F). These night and day temperatures are an average and some days may be even warmer. So be prepared and bring light clothes.
Find more detailed climate information for Al Batinah in November here.
Perfect weather is subjective. On this map perfect weather has been defined with temperatures between 20°C (68°F) and 29°C (84°F) and not too much precipitation (less than 90 mm (3.5 in) a month).
Perfect weather is subjective. On this map perfect weather has been defined with temperatures between 20°C (68°F) and 29°C (84°F) and not too much precipitation (less than 90 mm (3.5 in) a month).
More climate information for the top 3 destinations in Al Batinah:
Need travel inspiration? Check out our bucket list articles and be inspired.
Spot turtles in Oman
Oman is one of the countries with the most important turtle beaches in the world. April to June offers the best weather and plenty of Turtles.
 Stargaze at the Sharqiya Sands
The Sharqiya Sands (formerly known as Wahiba Sands) is a desert how you imagine a desert to be. An almost uninhabited strip of sand with towering endless dunes that have been formed by the wind into perfectly rounded hills.