


















 An alternative way to discover Sydney
We have made an overview of the sights in Sydney that you must see if you want to visit Sydney in an alternative way.
Thinking of visiting Munda in November? Expect high temperatures reaching 29°C (84°F) during the day, dropping to 26°C (79°F) at night. Heavy showers are common during the rainy season.
If you're looking for dry conditions and comfortable temperatures, November may not be the ideal month to visit Munda. Our weather planner can help you explore destinations with more pleasant weather conditions.
 Min Temperature
Max Temperature
 Chance of Rain
Precipitation
Rainy days
 Humidity
Pick a month to see the average temperature, rainfall and sunshine in Munda - and find the best time to visit.
42-year average (1976-2025)
Based on our historical records, temperatures in Munda typically stay consistent throughout November, with daily highs averaging around 29°C (84°F). Nights are warm, with lows around 25°C (77°F).
42-year average (1976-2025)
Average daily rainfall for each day of the month based on long-term records.
Browse day-by-day weather records for Munda spanning 51 years. Select any month and year to see actual temperatures, rainfall, and conditions recorded on each day.
According to our 19 years of weather records for Munda, the following extremes were recorded between 2006 and 2025.
Find out more about the weather in Solomon Islands and which places have the best travel conditions in this month. See all of Solomon Islands in November →
Perfect weather is subjective. On this map perfect weather has been defined with temperatures between 20°C (68°F) and 29°C (84°F) and not too much precipitation (less than 90 mm (3.5 in) a month).
Warm temperatures in November make for comfortable sightseeing weather. Pack breathable fabrics like cotton shirts, knee-length shorts or skirts, and comfortable walking shoes. A thin long sleeve for indoor spaces is handy. Heavy rain is guaranteed, please bring a good poncho and waterproof everything!
We rated the following activities from 1 (least suitable) to 10 (best) to do.


See the full Munda climate overview or explore weather in Solomon Islands.
Where to go in November - average daytime high across popular destinations.
Need travel inspiration? Check out our bucket list articles and be inspired.
An alternative way to discover Sydney
We have made an overview of the sights in Sydney that you must see if you want to visit Sydney in an alternative way.
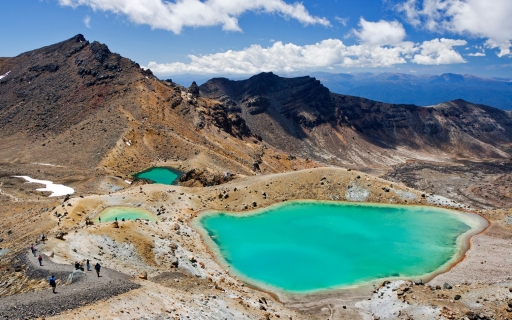
 The Tongariro Crossing in New Zealand
It is called the most beautiful walk in New Zealand, the Tongariro Crossing. The official hiking season starts late October until end of April.
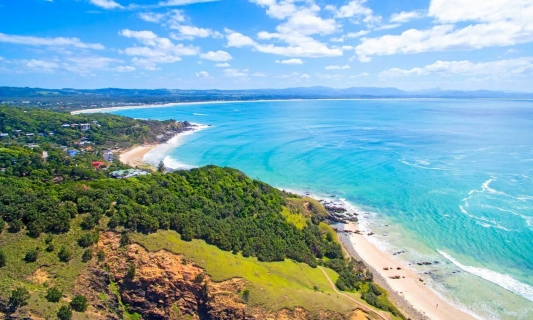 The most relaxed and alternative area of Australia is called the Byron Shire
The Byron Shire is one of the most pretty areas in the world. Not only in terms on natural beauty, also the relaxed vibe and people make this an area that remains close to your heart.
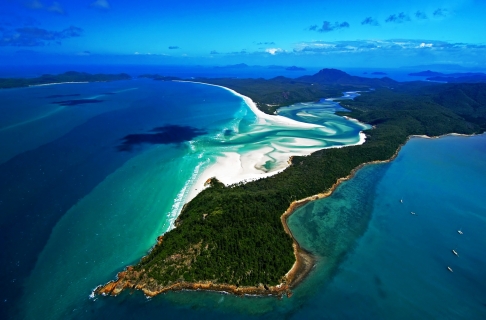 Sail the Whitsunday islands
The best travel period to sail the Whitsunday islands is “winter” between June and October, with pleasant temperatures around 23 degrees Celsius (74 Fahrenheit).