



















 Mud festival in South Korea
In July, the peaceful seaside town of Boryeong turned into a chaos of mud for 9 days. We recommend putting this festival on your bucket list.
With daytime temperatures of 12°C (54°F) and nighttime lows of 3°C (37°F), November in Yangyang brings moderate temperatures during the day. Do keep in mind that quite a bit of rainfall is typical. Around 64 mm (2.5 in) falls on average.
If your ideal day consists of dry skies and pleasant temperatures, May typically offers the best circumstances for Yangyang.
 Min Temperature
Max Temperature
Min Temperature
Max Temperature
 Chance of Rain
Precipitation
Rainy days
Chance of Rain
Precipitation
Rainy days
Pick a month to see the average temperature, rainfall and sunshine in Yangyang - and find the best time to visit.
50-year average (1976-2025)
Based on our historical records, temperatures in Yangyang typically drop from around 16°C (61°F) at the start of November to approximately 9°C (48°F) by the end. Nights are cold, with lows typically ranging from 0°C (32°F) to 7°C (45°F).
50-year average (1976-2025)
Average daily rainfall for each day of the month based on long-term records.
Browse day-by-day weather records for Yangyang spanning 51 years. Select any month and year to see actual temperatures, rainfall, and conditions recorded on each day.
The extremes listed below come from historical weather data collected in Yangyang from 1976 through 2025.
Find out more about the weather in South Korea and which places have the best travel conditions in this month. See all of South Korea in November →
Perfect weather is subjective. On this map perfect weather has been defined with temperatures between 20°C (68°F) and 29°C (84°F) and not too much precipitation (less than 90 mm (3.5 in) a month).
Pack for changing conditions in Yangyang in November. Bring a mix of short and long sleeves, a warm layer like a hoodie or light jacket, and comfortable pants. The key is being able to add or remove layers as the days goes by. Rain gear is recommended, you can expect wet weather on multiple days.
We rated the following activities from 1 (least suitable) to 10 (best) to do.


See the full Yangyang climate overview or explore weather in South Korea.
Where to go in November - average daytime high across popular destinations.
Need travel inspiration? Check out our bucket list articles and be inspired.
Mud festival in South Korea
In July, the peaceful seaside town of Boryeong turned into a chaos of mud for 9 days. We recommend putting this festival on your bucket list.
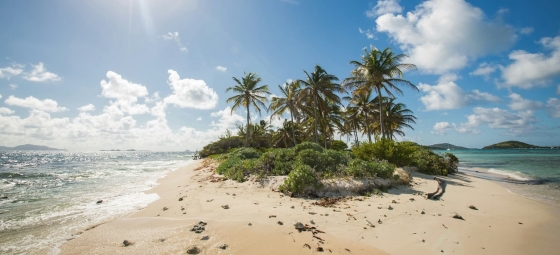
 10 Hidden gems in Asia you need to visit
Explore 10 hidden gems in Asia offering authentic experiences, from pristine beaches and remote islands to cultural treks and peaceful mountain villages.
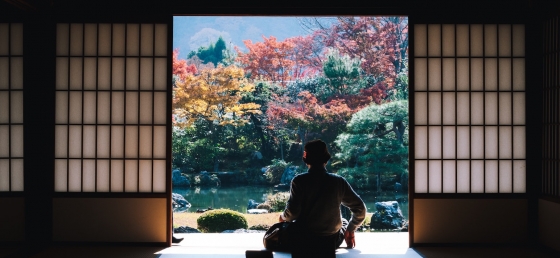
 Chase the autumn leaves in Japan
Japan is one of these cases which turns into a gold, yellow and orange fairy tale starting from September. And we can honestly say: We cannot imagine a more beautiful season to visit Japan.

 The 10 Most Exquisite Beaches in the Philippines
Explore the top 10 breathtaking beaches in the Philippines, from serene Nacpan Beach to volcanic Camiguin Island, in our detailed guide.