



















 The Li River: A Journey Through China’s Most Breathtaking Landscape
Explore the Li River, China's breathtaking landscape with majestic mountains, serene waters, and picturesque views. A must-see for every traveler.
Thinking of visiting Qinhuangdao in September? Expect high temperatures reaching 25°C (77°F) during the day, dropping to 17°C (63°F) at night, with some rainfall likely.
If your ideal day consists of dry skies and pleasant temperatures, May, June and September typically offer the best circumstances for Qinhuangdao.
 Min Temperature
Max Temperature
Min Temperature
Max Temperature
 Chance of Rain
Precipitation
Rainy days
Chance of Rain
Precipitation
Rainy days
Pick a month to see the average temperature, rainfall and sunshine in Qinhuangdao - and find the best time to visit.
50-year average (1976-2025)
Based on our historical records, temperatures in Qinhuangdao typically drop from around 27°C (81°F) at the start of September to approximately 22°C (72°F) by the end. Nights are cool, with lows typically ranging from 10°C (50°F) to 17°C (63°F).
Browse day-by-day weather records for Qinhuangdao spanning 51 years. Select any month and year to see actual temperatures, rainfall, and conditions recorded on each day.
The extremes listed below come from historical weather data collected in Qinhuangdao from 1976 through 2025.
Find out more about the weather in China and which places have the best travel conditions in this month. See all of China in September →
Perfect weather is subjective. On this map perfect weather has been defined with temperatures between 20°C (68°F) and 29°C (84°F) and not too much precipitation (less than 90 mm (3.5 in) a month).
Warm temperatures in September make for comfortable sightseeing weather. Pack breathable fabrics like cotton shirts, knee-length shorts or skirts, and comfortable walking shoes. A thin long sleeve for indoor spaces is handy. Rain gear is recommended, you can expect wet weather on multiple days.
We rated the following activities from 1 (least suitable) to 10 (best) to do.


See the full Qinhuangdao climate overview or explore weather in China.
Where to go in September - average daytime high across popular destinations.
Need travel inspiration? Check out our bucket list articles and be inspired.
The Li River: A Journey Through China’s Most Breathtaking Landscape
Explore the Li River, China's breathtaking landscape with majestic mountains, serene waters, and picturesque views. A must-see for every traveler.
 Go to China's Zhangjiajie National Park with the highest, the fastest, largest-loaded outdoor elevator in the world
You won't find this unique landscape anywhere else in the world. Thousands of floating mountains overgrown with trees at the top dominate this fairy tale landscape.
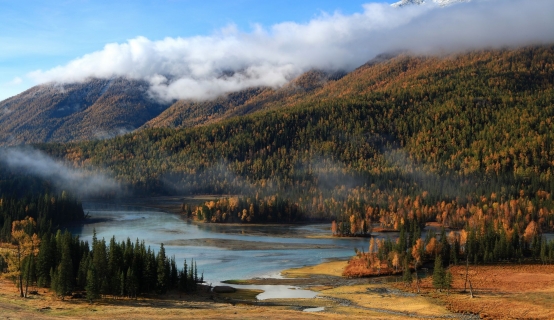 Go to Xinjiang in China
In Xinjiang you get to see a mix of East and Central Asia. An experience that you might want to add to your bucket list. You can travel through the province as if you are following an ancient silk route.
 Mount Kailash
The best time for a Kailash tour/trekking is from mid-May to mid-October when the temperature is most pleasant. It is warm, dry and sunny in that period.