

















 Explore the Majestic Copper Canyons of Mexico
Explore the vast Copper Canyons in Chihuahua, Mexico—larger than the Grand Canyon. Discover scenic train rides, hikes, and the Tarahumara people.
Pátzcuaro in September sees high temperatures, with highs around 23°C (73°F) and overnight lows of 13°C (55°F). With the rainy season in full effect, expect around 317 mm (12 in) of rainfall and regular showers throughout the month.
If you prefer dry days with pleasant temperatures, September may not be the ideal month to visit Pátzcuaro. Our weather planner can help you explore destinations with more pleasant weather conditions.
 Min Temperature
Max Temperature
Min Temperature
Max Temperature
 Chance of Rain
Precipitation
Rainy days
Chance of Rain
Precipitation
Rainy days
 Humidity
 Sunshine
Percentage Sunshine
Sunshine
Percentage Sunshine
Pick a month to see the average temperature, rainfall and sunshine in Pátzcuaro - and find the best time to visit.
48-year average (1977-2025)
Based on our historical records, temperatures in Pátzcuaro typically stay consistent throughout September, with daily highs averaging around 23°C (73°F). Nights are cool, with lows around 13°C (55°F).
48-year average (1977-2025)
Average daily rainfall for each day of the month based on long-term records.
Browse day-by-day weather records for Pátzcuaro spanning 51 years. Select any month and year to see actual temperatures, rainfall, and conditions recorded on each day.
Based on 39 years of weather observations in Pátzcuaro between 1986 and 2025, these are the recorded extremes.
Find out more about the weather in Mexico and which places have the best travel conditions in this month. See all of Mexico in September →
Perfect weather is subjective. On this map perfect weather has been defined with temperatures between 20°C (68°F) and 29°C (84°F) and not too much precipitation (less than 90 mm (3.5 in) a month).
For Pátzcuaro in September, you'll want flexible clothing. It's wise to pack cotton shirts, comfortable shorts, and a pair of jeans for cooler evenings. A light sweater or jacket is useful for air-conditioned spaces (like buses) or unexpected cool moments. Also bring a poncho, it will rain a lot! Waterproof everything you can. It won't hurt to bring your sunglasses along, as you'll see some sunny periods.
We rated the following activities from 1 (least suitable) to 10 (best) to do.


Temperature Rainfall Sunshine Humidity
See the full Pátzcuaro climate overview or explore weather in Mexico.
Where to go in September - average daytime high across popular destinations.
Puerto Peñasco 34°C (93°F) Los Cabos
 32°C (90°F) Tulum31°C (88°F) Cancún30°C (86°F) Playa del Carmen31°C (88°F) Puerto Vallarta29°C (84°F) San Miguel de Allende
 27°C (81°F) Mexico City23°C (73°F)
 Need travel inspiration? Check out our bucket list articles and be inspired.
Explore the Majestic Copper Canyons of Mexico
Explore the vast Copper Canyons in Chihuahua, Mexico—larger than the Grand Canyon. Discover scenic train rides, hikes, and the Tarahumara people.
 These are the most beautiful Mayan ruins and Mayan temples in Mexico
Mexico is a destination where you can immerse yourself in ancient cultures and civilizations. In this article we have listed our favorite Mayan ruins.
 Tips, to-do's and nicest restaurants in Mexico City
Mexico City, one of the most famous and notorious cities of the world. The best time to visit is between March and May, but it can be visited year round.
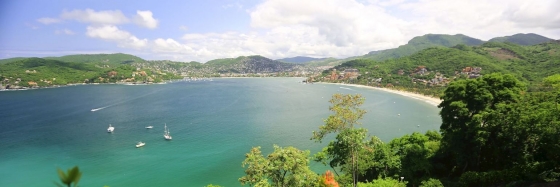 Zihuatanejo: A Pacific paradise with beautiful beaches
Zihuatanejo has some of Mexico's top beaches. Unlike other off-the-beaten-path destinations in Mexico, Zihua is very accessible and sustainable.