














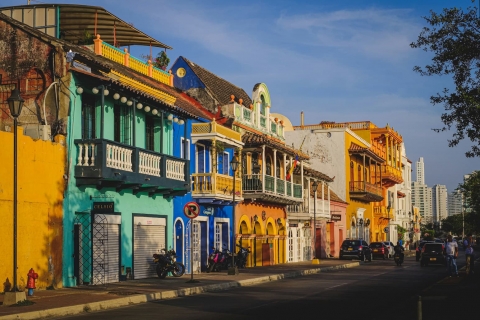
 The 10 most alternative cities in South America
Discover South America's top 10 alternative cities! From Valparaíso's vibrant streets to La Paz's high-altitude charm and Medellín's innovative spirit.
Las Tunas in October sees high daytime temperatures of 25°C (77°F) and nighttime lows of 21°C (70°F). Low rainfall is typical, with around 19 mm (0.7 in) for the month.
So this is a great month to visit if you prefer dry days with pleasant temperatures.
 Min Temperature
Max Temperature
 Chance of Rain
Precipitation
Rainy days
Pick a month to see the average temperature, rainfall and sunshine in Las Tunas - and find the best time to visit.
48-year average (1976-2025)
Based on our historical records, temperatures in Las Tunas typically stay consistent throughout October, with daily highs averaging around 25°C (77°F). Nights are warm, with lows around 22°C (72°F).
48-year average (1976-2025)
Average daily rainfall for each day of the month based on long-term records.
Browse day-by-day weather records for Las Tunas spanning 51 years. Select any month and year to see actual temperatures, rainfall, and conditions recorded on each day.
Based on weather observations in Las Tunas between 2000 and 2025, these are the recorded extremes during October.
Find out more about the weather in Ecuador and which places have the best travel conditions in this month. See all of Ecuador in October →
Perfect weather is subjective. On this map perfect weather has been defined with temperatures between 20°C (68°F) and 29°C (84°F) and not too much precipitation (less than 90 mm (3.5 in) a month).
Warm weather calls for comfortable, breathable clothing in October. Cotton t-shirts, shorts, light dresses, and sandals are perfect. You might still want a light layer for evenings or air-conditioned places (for example buses). Almost no rain is expected, so no need to bring rain gear.
We rated the following activities from 1 (least suitable) to 10 (best) to do.


See the full Las Tunas climate overview or explore weather in Ecuador.
Where to go in October - average daytime high across popular destinations.
 Guayaquil
 29°C (84°F) Montañita
 26°C (79°F) Puerto Ayora26°C (79°F) Salinas24°C (75°F) Puerto Baquerizo Moreno
 23°C (73°F) Quito
 19°C (66°F) Baños18°C (64°F) Cuenca16°C (61°F)
Need travel inspiration? Check out our bucket list articles and be inspired.
The 10 most alternative cities in South America
Discover South America's top 10 alternative cities! From Valparaíso's vibrant streets to La Paz's high-altitude charm and Medellín's innovative spirit.
 The Galapagos Islands
 is one of the most beautiful places on earth. If you want to see the origins of our planet with your own eyes, you should travel here.
 A rain forest hotel in the clouds
This is not "just a lodge". It is a sanctuary of peace and nature for those who like to stay in the heart of nature with minimal environmental impact.

 Visit the Rainbow Mountains
The Rainbow Mountain (Vinicunca) is acolored rainbow mountain that will steal your heart forever and the view from the top will take your breath away.