











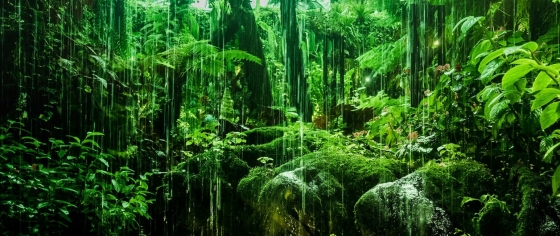
 The top 5 unexplored rainforests in Central America
Dive into Central America's top 5 hidden rainforests for an unparalleled journey through vibrant wildlife and diverse landscapes.
La Libertad in November averages 30°C (86°F) during the day and 24°C (75°F) at night. Some rainfall is typical for this time of year.
If you prefer enjoying temperate temperatures and rain-free days, January, February, March and December typically offer the best circumstances. If you're seeking pleasant, dry and sunny weather somewhere else in the world, our weather planner can help you explore other options.
 Min Temperature
Max Temperature
 Chance of Rain
Precipitation
Rainy days
 Humidity
 Sunshine
Percentage Sunshine
Pick a month to see the average temperature, rainfall and sunshine in La Libertad - and find the best time to visit.
40-year average (1977-2025)
Based on our historical records, temperatures in La Libertad typically stay consistent throughout November, with daily highs averaging around 30°C (86°F). Nights are warm, with lows around 21°C (70°F).
40-year average (1977-2025)
Average daily rainfall for each day of the month based on long-term records.
Browse day-by-day weather records for La Libertad spanning 51 years. Select any month and year to see actual temperatures, rainfall, and conditions recorded on each day.
Find out more about the weather in El Salvador and which places have the best travel conditions in this month. See all of El Salvador in November →
Perfect weather is subjective. On this map perfect weather has been defined with temperatures between 20°C (68°F) and 29°C (84°F) and not too much precipitation (less than 90 mm (3.5 in) a month).
Warm weather calls for comfortable, breathable clothing in November. Cotton t-shirts, shorts, light dresses, and sandals are perfect. You might still want a light layer for evenings or air-conditioned places (for example buses). Rain is likely on several days, so bring a good rain jacket. You'll definitely want to pack sunglasses and sunscreen. There will be plenty of bright sunshine this month.
We rated the following activities from 1 (least suitable) to 10 (best) to do.


Temperature Rainfall Sunshine Humidity
See the full La Libertad climate overview or explore weather in El Salvador.
Where to go in November - average daytime high across popular destinations.
 San Salvador
 32°C (90°F) El Cuco
 31°C (88°F) El Zonte30°C (86°F) Santa Ana31°C (88°F) Concepción de Ataco30°C (86°F) La Libertad30°C (86°F) El Sunzal30°C (86°F)
Need travel inspiration? Check out our bucket list articles and be inspired.
The top 5 unexplored rainforests in Central America
Dive into Central America's top 5 hidden rainforests for an unparalleled journey through vibrant wildlife and diverse landscapes.
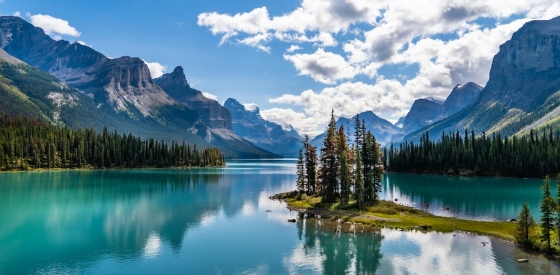
 The 5 most beautiful lakes in Canada
Explore Canada's stunning lakes: Lake Louise, Lake Superior, Maligne Lake, Emerald Lake, and Lake Okanagan, each offering unique beauty and activities.
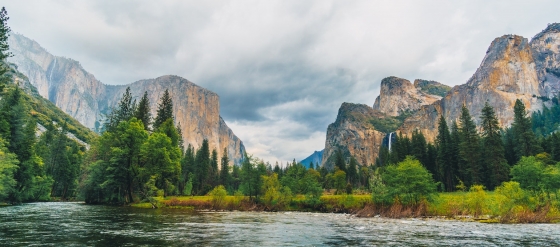
 Yosemite National Park is definitely worth a visit
Vast forests, blue lakes, towering sequoias, and majestic waterfalls hint at the beauty of Yosemite National Park—a true natural masterpiece.
 The 10 most alternative cities in the United States
Discover the top 10 fun and alternative U.S. cities rich in art, culture, and adventure. From Portland's hippy charm to Sedona's stunning landscapes.