

















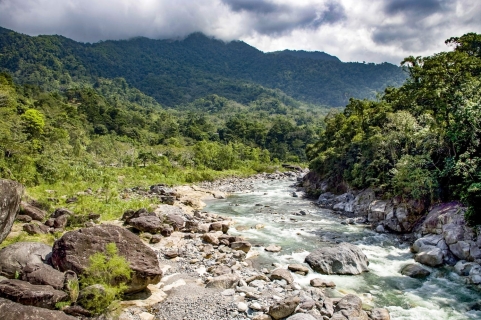
 Pico Bonito: Honduras' enchanting jungle adventure awaits
Explore Pico Bonito, Honduras' largest national park. Discover diverse wildlife, exhilarating activities, and lush landscapes. Your jungle adventure begins here!
March in Barra de Chapagua sees daytime temperatures around 30°C (86°F) and lows of 23°C (73°F) at night. With around 81 mm (3.2 in) of rainfall expected, it's worth packing a rain jacket.
If your ideal day consists of dry skies and pleasant temperatures, February typically offers the best circumstances for Barra de Chapagua.
 Min Temperature
Max Temperature
Min Temperature
Max Temperature
 Chance of Rain
Precipitation
Rainy days
Chance of Rain
Precipitation
Rainy days
Pick a month to see the average temperature, rainfall and sunshine in Barra de Chapagua - and find the best time to visit.
35-year average (1984-2025)
Based on our historical records, temperatures in Barra de Chapagua typically stay consistent throughout March, with daily highs averaging around 30°C (86°F). Nights are warm, with lows around 22°C (72°F).
Browse day-by-day weather records for Barra de Chapagua spanning 51 years. Select any month and year to see actual temperatures, rainfall, and conditions recorded on each day.
The extremes listed below come from historical weather data collected in Barra de Chapagua from 2006 through 2026.
Find out more about the weather in Honduras and which places have the best travel conditions in this month. See all of Honduras in March →
Perfect weather is subjective. On this map perfect weather has been defined with temperatures between 20°C (68°F) and 29°C (84°F) and not too much precipitation (less than 90 mm (3.5 in) a month).
Warm temperatures in March make for comfortable sightseeing weather. Pack breathable fabrics like cotton shirts, knee-length shorts or skirts, and comfortable walking shoes. A thin long sleeve for indoor spaces is handy. Prepare for significant rainfall with proper waterproof clothing and shoes.
We rated the following activities from 1 (least suitable) to 10 (best) to do.


See the full Barra de Chapagua climate overview or explore weather in Honduras.
Where to go in March - average daytime high across popular destinations.
San Pedro Sula 31°C (88°F) Tegucigalpa
 31°C (88°F) West Bay28°C (82°F) Roatán
 28°C (82°F) Utila28°C (82°F) West End28°C (82°F) La Ceiba27°C (81°F) Copán Ruinas28°C (82°F)
 Need travel inspiration? Check out our bucket list articles and be inspired.
Pico Bonito: Honduras' enchanting jungle adventure awaits
Explore Pico Bonito, Honduras' largest national park. Discover diverse wildlife, exhilarating activities, and lush landscapes. Your jungle adventure begins here!

 The top 5 unexplored rainforests in Central America
Dive into Central America's top 5 hidden rainforests for an unparalleled journey through vibrant wildlife and diverse landscapes.
 The unspoiled Bahía Islands in Honduras
Discover Roatán, the largest of the Bahía Islands, a paradise for divers and snorkelers with stunning reefs and wildlife. Best visited February to July.
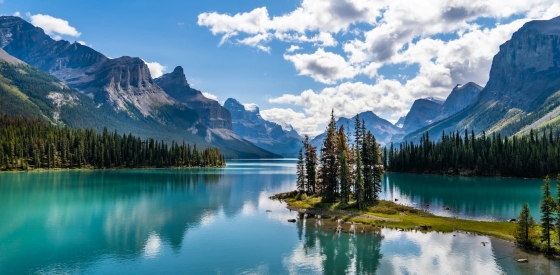
 The 5 most beautiful lakes in Canada
Explore Canada's stunning lakes: Lake Louise, Lake Superior, Maligne Lake, Emerald Lake, and Lake Okanagan, each offering unique beauty and activities.