












 The 10 most alternative cities in South America
Discover South America's top 10 alternative cities! From Valparaíso's vibrant streets to La Paz's high-altitude charm and Medellín's innovative spirit.
Barichara in August averages 25°C (77°F) during the day and 15°C (59°F) at night. August is part of the rainy season, so frequent rainfall is typical.
Our weather planner can help you find worldwide destinations with pleasant weather during this period. January typically offers the best weather for Barichara.
 Min Temperature
Max Temperature
Min Temperature
Max Temperature
 Chance of Rain
Precipitation
Rainy days
Chance of Rain
Precipitation
Rainy days
 Humidity
 Sunshine
Percentage Sunshine
Sunshine
Percentage Sunshine
Pick a month to see the average temperature, rainfall and sunshine in Barichara - and find the best time to visit.
47-year average (1976-2025)
Based on our historical records, temperatures in Barichara typically stay consistent throughout August, with daily highs averaging around 25°C (77°F). Nights are pleasant, with lows around 19°C (66°F).
Browse day-by-day weather records for Barichara spanning 51 years. Select any month and year to see actual temperatures, rainfall, and conditions recorded on each day.
According to our 21 years of weather records for Barichara, the following extremes were recorded between 2005 and 2026.
Find out more about the weather in Colombia and which places have the best travel conditions in this month. See all of Colombia in August →
Perfect weather is subjective. On this map perfect weather has been defined with temperatures between 20°C (68°F) and 29°C (84°F) and not too much precipitation (less than 90 mm (3.5 in) a month).
Pleasant temperatures in August mean you can pack light but flexibel pieces. Think cotton t-shirts, comfortable walking shorts, and one warmer layer for evenings. A light sweater or denim jacket works well. Heavy rain is guaranteed, please bring a good poncho and waterproof everything! Sunglasses could come in handy during the sunnier parts of your trip.
Temperature Rainfall Sunshine Humidity
See the full Barichara climate overview or explore weather in Colombia.
Where to go in August - average daytime high across popular destinations.
 Cartagena
 31°C (88°F) Santa Marta29°C (84°F) San Andrés29°C (84°F) Cali
 28°C (82°F) Medellín26°C (79°F) Pereira24°C (75°F) Bogotá21°C (70°F) Villa de Leyva
 20°C (68°F)
 Need travel inspiration? Check out our bucket list articles and be inspired.
The 10 most alternative cities in South America
Discover South America's top 10 alternative cities! From Valparaíso's vibrant streets to La Paz's high-altitude charm and Medellín's innovative spirit.
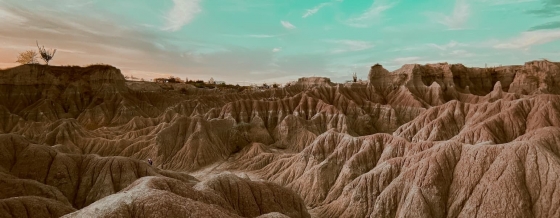 5 Hidden Gems in Colombia
Explore Colombia's hidden gems, from El Cocuy's remote beauty to Providencia's serene beaches, offering authentic experiences off the beaten path.
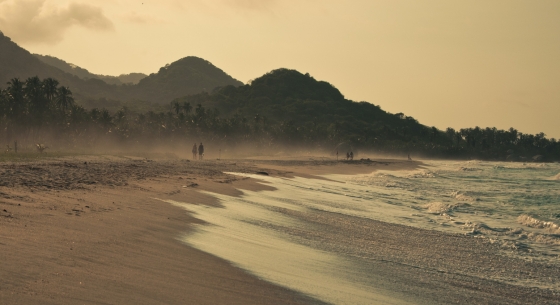 Tayrona National Park: the most beautiful part of Colombia
Visit the park between the months December and March (not February since it is closed) or from June till August (this is high season).
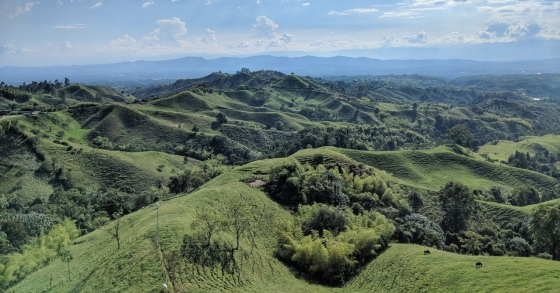 Breathtaking view in Minca
Minca is a tiny village in the tropical rain forest of Colombia and is an oasis of tranquility. Everyone looking for a relatively undiscovered piece of Colombia is in the right place here.