



















 The 10 most charming villages in France
Discover France's top 10 beautiful villages. From Normandy to the Côte d'Azur, experience quaint squares and cobbled streets. Which one will you visit this summer?
October in Barbirey-sur-Ouche brings moderate temperatures, with daytime highs of 16°C (61°F) and nights around 7°C (45°F). Quite a bit of rainfall is expected, around 87 mm (3.4 in), so pack an umbrella.
If you prefer enjoying temperate temperatures and rain-free days, May, June, July, August and September typically offer the best circumstances. If you're seeking pleasant, dry and sunny weather somewhere else in the world, our weather planner can help you explore other options.
 Min Temperature
Max Temperature
Min Temperature
Max Temperature
 Chance of Rain
Precipitation
Rainy days
Chance of Rain
Precipitation
Rainy days
 Humidity
 Windspeed
 Sunshine
Percentage Sunshine
Sunshine
Percentage Sunshine
Pick a month to see the average temperature, rainfall and sunshine in Barbirey-sur-Ouche - and find the best time to visit.
Find out more about the weather in France and which places have the best travel conditions in this month. See all of France in October →
Perfect weather is subjective. On this map perfect weather has been defined with temperatures between 20°C (68°F) and 29°C (84°F) and not too much precipitation (less than 90 mm (3.5 in) a month).
Pleasant temperatures in October mean you can pack light but flexibel pieces. Think cotton t-shirts, comfortable walking shorts, and one warmer layer for evenings. A light sweater or denim jacket works well. Prepare for significant rainfall with proper waterproof clothing and shoes. Bring sunglasses since you'll have some sunny periods throughout the month
We rated the following activities from 1 (least suitable) to 10 (best) to do.


Temperature Rainfall Sunshine Humidity Wind Speed
See the full Barbirey-sur-Ouche climate overview or explore weather in France.
Where to go in October - average daytime high across popular destinations.
Need travel inspiration? Check out our bucket list articles and be inspired.
The 10 most charming villages in France
Discover France's top 10 beautiful villages. From Normandy to the Côte d'Azur, experience quaint squares and cobbled streets. Which one will you visit this summer?
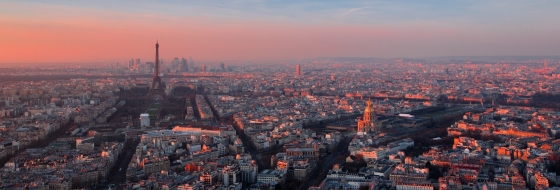 An alternative way to discover Paris
From street art, vintage shops, vegetarian cafes, to amazing cultural events, Paris has much to offer for the creative traveler. An overview of sights that you must see if you want to visit this city in an alternative way.
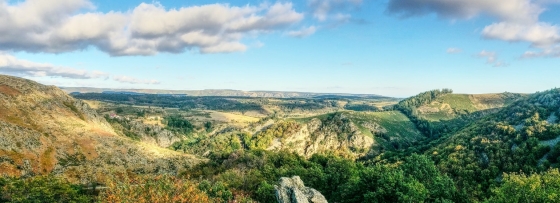 Nature is allowed to take its course in the Ardeche
The Ardèche is France at its most beautiful. The authentic villages and breathtaking mountainous landscapes are one of the main reasons. he climate in Ardèche is very pleasant. Temperatures are high during summer and it is often very sunny.

 Explore the natural wonders of Corsica
Corsica offers an abundance of incredible natural wonders to explore. This stunning Mediterranean island is a paradise for outdoor enthusiasts and nature lovers alike.