Climate ▸Forecast ▸March ▸April ▸
JanuaryFebruaryMarchAprilMayJuneJulyAugustSeptemberOctoberNovemberDecember

Average water temperature in Ljubač

On this page you find the mean water temperature over the year in Ljubač (Zadar County), Croatia. Understand how water temperatures vary throughout the year.

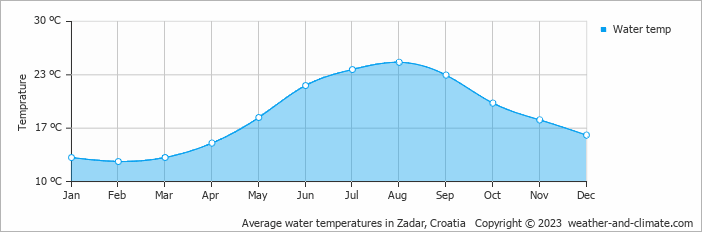
Data from: Zadar, Croatia (17 KM, 10 Miles).

Ljubač experiences water temperature shifts throughout the year. The warmest month, August, reaches an average of 25°C.

The coldest month, February, averages 13°C. Visitors during these months can leave their swimming gear at home.


Forecast for Ljubač

Monday
31 Mar
Fair
Fair
15°C
0.1 mm
Tuesday
1 Apr
Light rain
Light rain
12°C
0.9 mm
Wednesday
2 Apr
Cloudy
Cloudy
15°C
0 mm

Interested in more climate information?

This site provides you with all the information you need about the climate in Ljubač.

Our site offers climate and forecast data for every country in the world. Are you going to Croatia? On this website you can find historical weather averages for many cities in Croatia. Not sure yet where to go? We now have a tool which recommends destinations that suit your ideal travel conditions. Find out where to go with our weather planner.

) ?>